...
The high level overview of the Earth's Geothermal Temperature Profile in is brought at Fig 1.
The zoomed picture of a typical Geothermal Temperature Profile in Sedimentary Cover of the Earth's Crust is brought at Fig 2.
|
|


| Fig. 1. Schematic picture of Geothermal Temperature Profile of the Earth. | Fig. 2. A sample of Geothermal Temperature Gradient in Sedimentary Cover of the Earth's Crust. |
Impact from Surface Temperature Variations
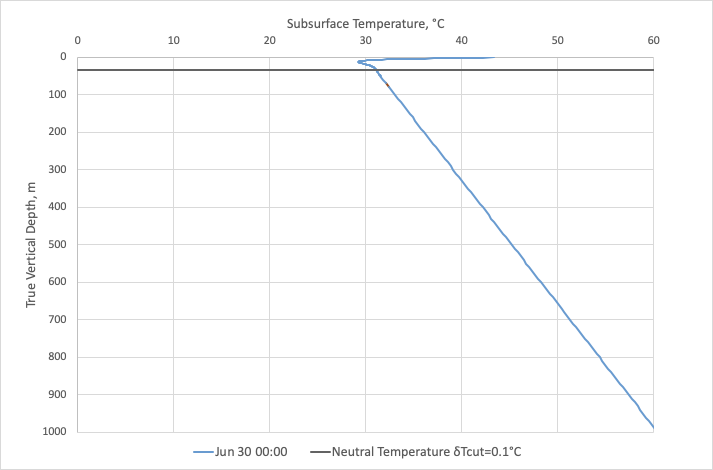
The surface temperature variations penetrate the Sedimentary Cover all the way down to the Neutral Temperature Layer (NTL) (see Fig. 3) which varies from few meters to few dozens of meters.
...
|
|
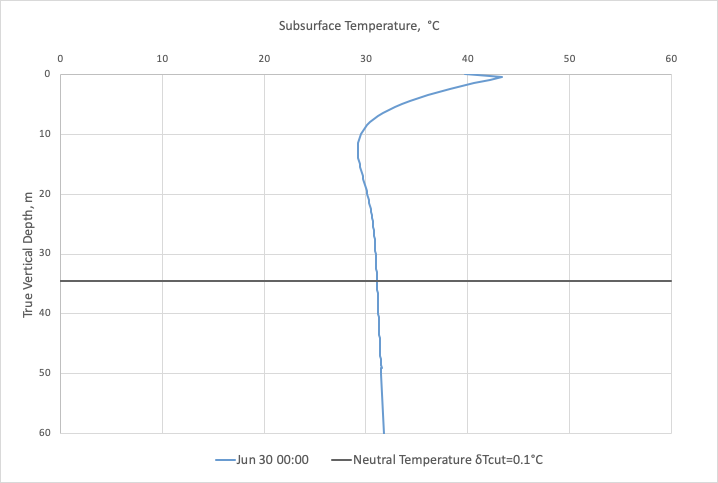
| Fig. 3.1. A sample of Geothermal Temperature Profile captured at a certain time moment when surface temperature was higher than annual average. | Fig. 3.2. A sample of Geothermal Temperature Profile with depth zoom around temperature variations above Neutral Temperature Layer captured at a certain time moment when surface temperature was higher than annual average but lower than monthly average. |
|
|
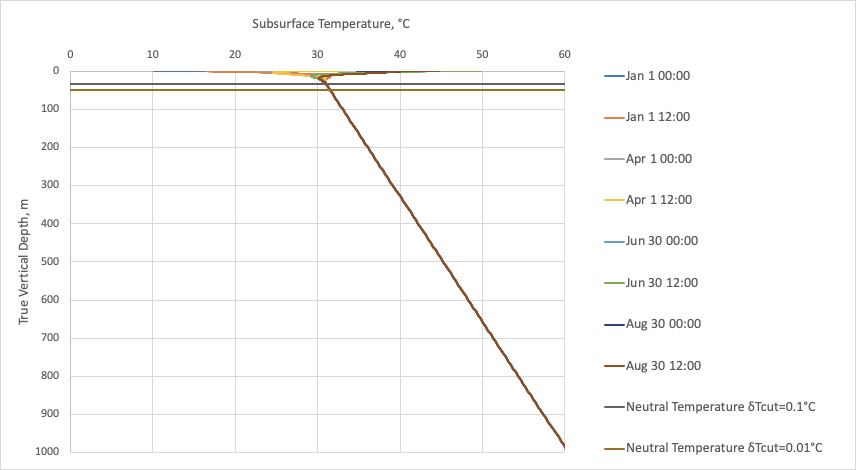
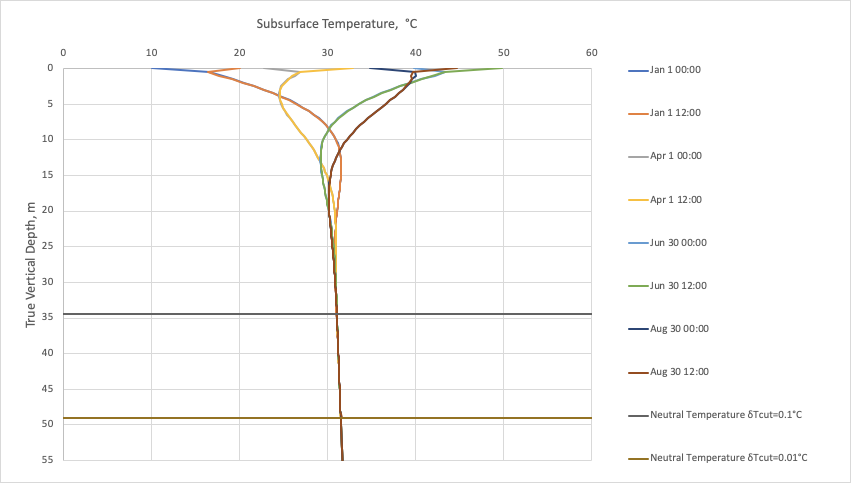
| Fig. 3.3. A sample of Geothermal Temperature Profile captured at different time moments. | Fig. 3.4. A sample of Geothermal Temperature Profile captured at different time moments with zoom around temperature variations above Neutral Temperature Layer |
The An imaginary subsurface temperature profile for under assumption of the constant surface temperature temperature
is called Unbiased Geothermal Temperature Profile LaTeX Math Inline body T_s(t) = \rm const
(see Fig. 4).LaTeX Math Inline body --uriencoded--T_%7BGN%7D(z)
|
| Fig. 4. A typical example of Geothermal Temperature Profile (TG) and Unbiased Geothermal Temperature Profile (TGN) |

See Also
...
Geology / Geothermal Temperature Field
...