...
|
Fig. 1. Production path of the Black Oil Reservoir on the Phase Equilibrium Diagram. The downward solid black arrow shows a reservoir pressure depletion path. The downward grey dash arrow shows a wellbore lift pressure drop path. |
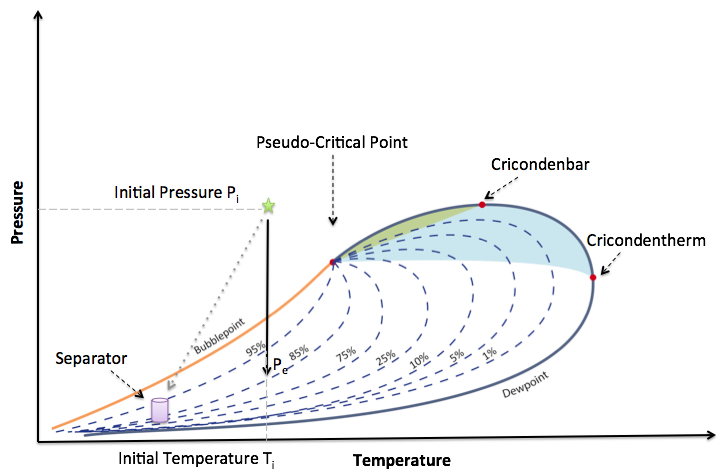
Table 1 – Example of Black Oil composition (in mol % )
| CO2 | 0.02 |
| N2 | 0.34 |
| C1 | 34.62 |
| C2 | 4.11 |
| C3 | 1.01 |
| i C4 | 0.76 |
| n C4 | 0.49 |
| i C5 | 0.43 |
| n C5 | 0.21 |
| C6s | 1.16 |
| C7+ | 56.40 |
| Rs (SCF/STB) | 320 |
| Rv (STB/MMSCF) | 3125 |
| API gravity | 23.6 |
| M7+ | 274 |
| γ7+ | 0.920 |
See Also
...
Petroleum Industry / Upstream / Subsurface E&P Disciplines / Petroleum Geology / Petroleum reservoir / Hydrocarbon reservoir / Oil Reservoir / Undersaturated Oil Reservoir
...