...
This happens, for example, at the lateral scales of a typical Petroleum Field and allows modelling Geothermal Temperature Field with a laterally constant Geothermal Temperature Profile
.LaTeX Math Inline body T_G(z)
The high level overview of Geothermal Temperature Profile in given at Fig 1.
| |
| Fig. 1. Schematic picture of Geothermal Temperature Profile of the Earth. | Fig. 2. A sample of Geothermal Temperature Gradient in Sedimentary Cover of the Earth's Crust. |

|
|
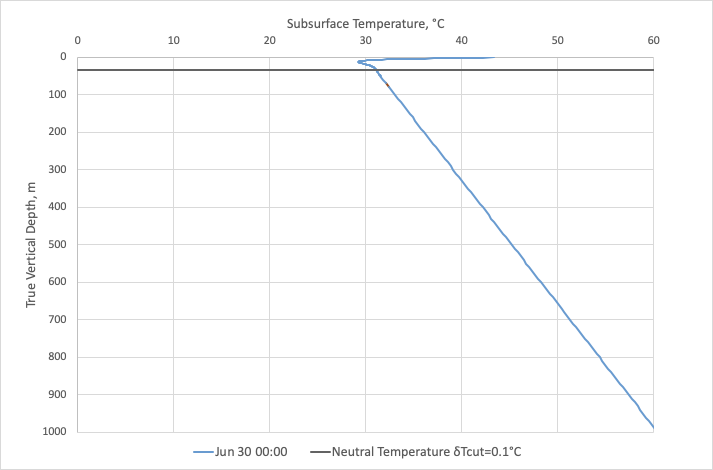
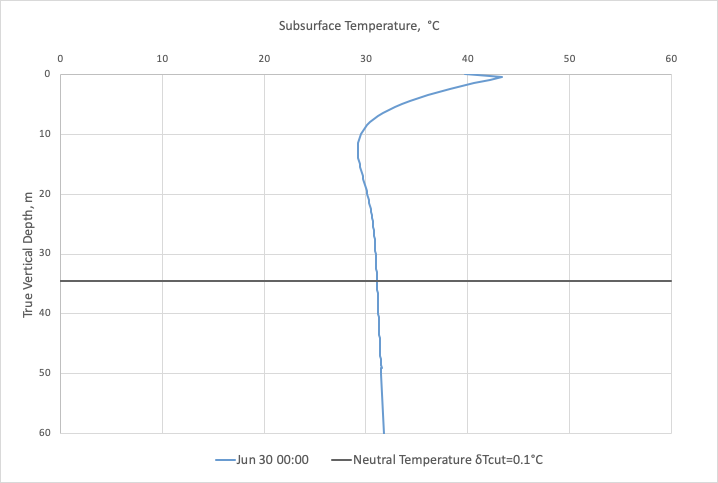
| Fig. 13.1. A sample of Geothermal Temperature Profile captured at a certain time moment when surface temperature was higher than annual average. | Fig. 13.2. A sample of Geothermal Temperature Profile with depth zoom around temperature variations above Neutral Temperature Layer captured at a certain time moment when surface temperature was higher than annual average but lower than monthly average. |
|
|
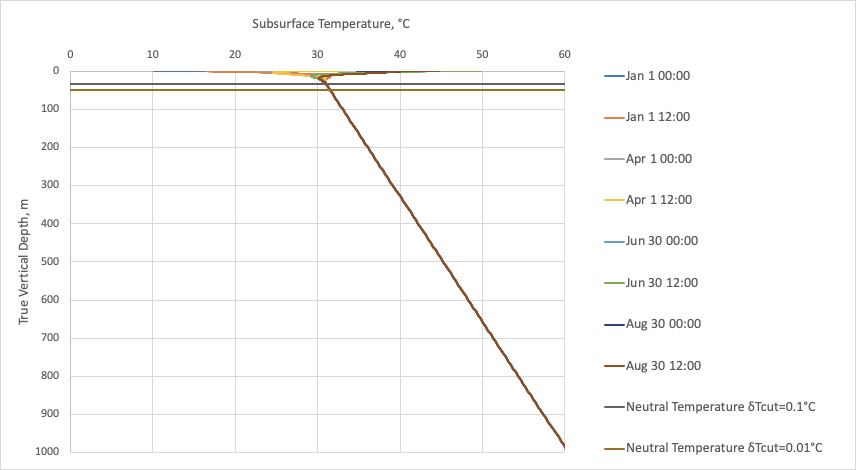
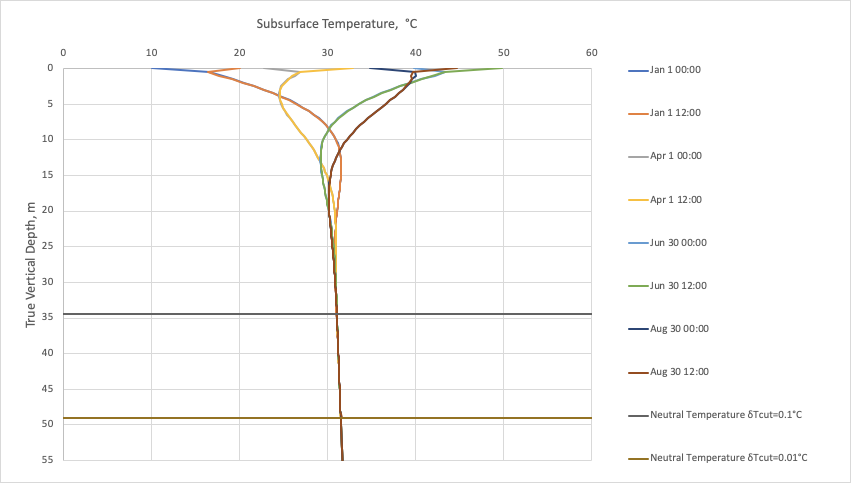
| Fig. 13.3. A sample of Geothermal Temperature Profile at captured at different time moments. | Fig. 13.4. A sample of Geothermal Temperature Profile at captured at different time moments with zoom around temperature variations above Neutral Temperature Layer |
...