...
| production/injection time | ||||||||||||
| total sandface flowrate as function of time
| ||||||||||||
| drain-area formation pressure as function of time
| ||||||||||||
| bottomhole pressure as function of time
|
|
| Fig. 1.1. Hall Plot |
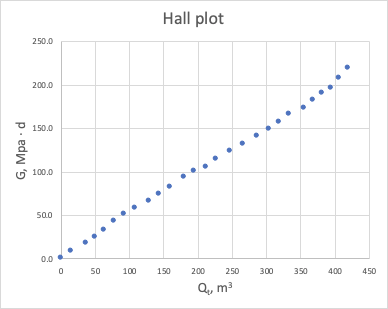
It shows unit slope on log-log plot for stabilized reservoir flow:
...