...
The Inflow Performance Relation (IPR) analysis is closely related to well Productivity Index (PI)
| LaTeX Math Inline | ||
|---|---|---|
|
| for oil producer with oil flowrate
| |||||||||||
| for gas producer with gas flowrate
| |||||||||||
| for gas injector with injection rate
| |||||||||||
| for water injector with injection rate
|
where
| field-average formation pressure estimate within the drainage area
|
Based on above defintions the aribitrary IPR can be wirtten in a general form:
...
providing that
| LaTeX Math Inline | ||
|---|---|---|
|
| for producer | ||||
| for injector | ||||
| for oil producer | ||||
| for gas producer or injector | ||||
| for water injector or water producer or water production from oil producer |
See more on the variations of PI definition between Dynamic Modelling, Well Flow Performance and Well Testing.
...
For a single layer formation with low-compressibility fluid (water or dead oil) the PI does not depend on drawdown (or flowrate)
| LaTeX Math Inline | ||
|---|---|---|
|
|
| Fig.1. IPR plot for constant productivity (water and dead oil) |
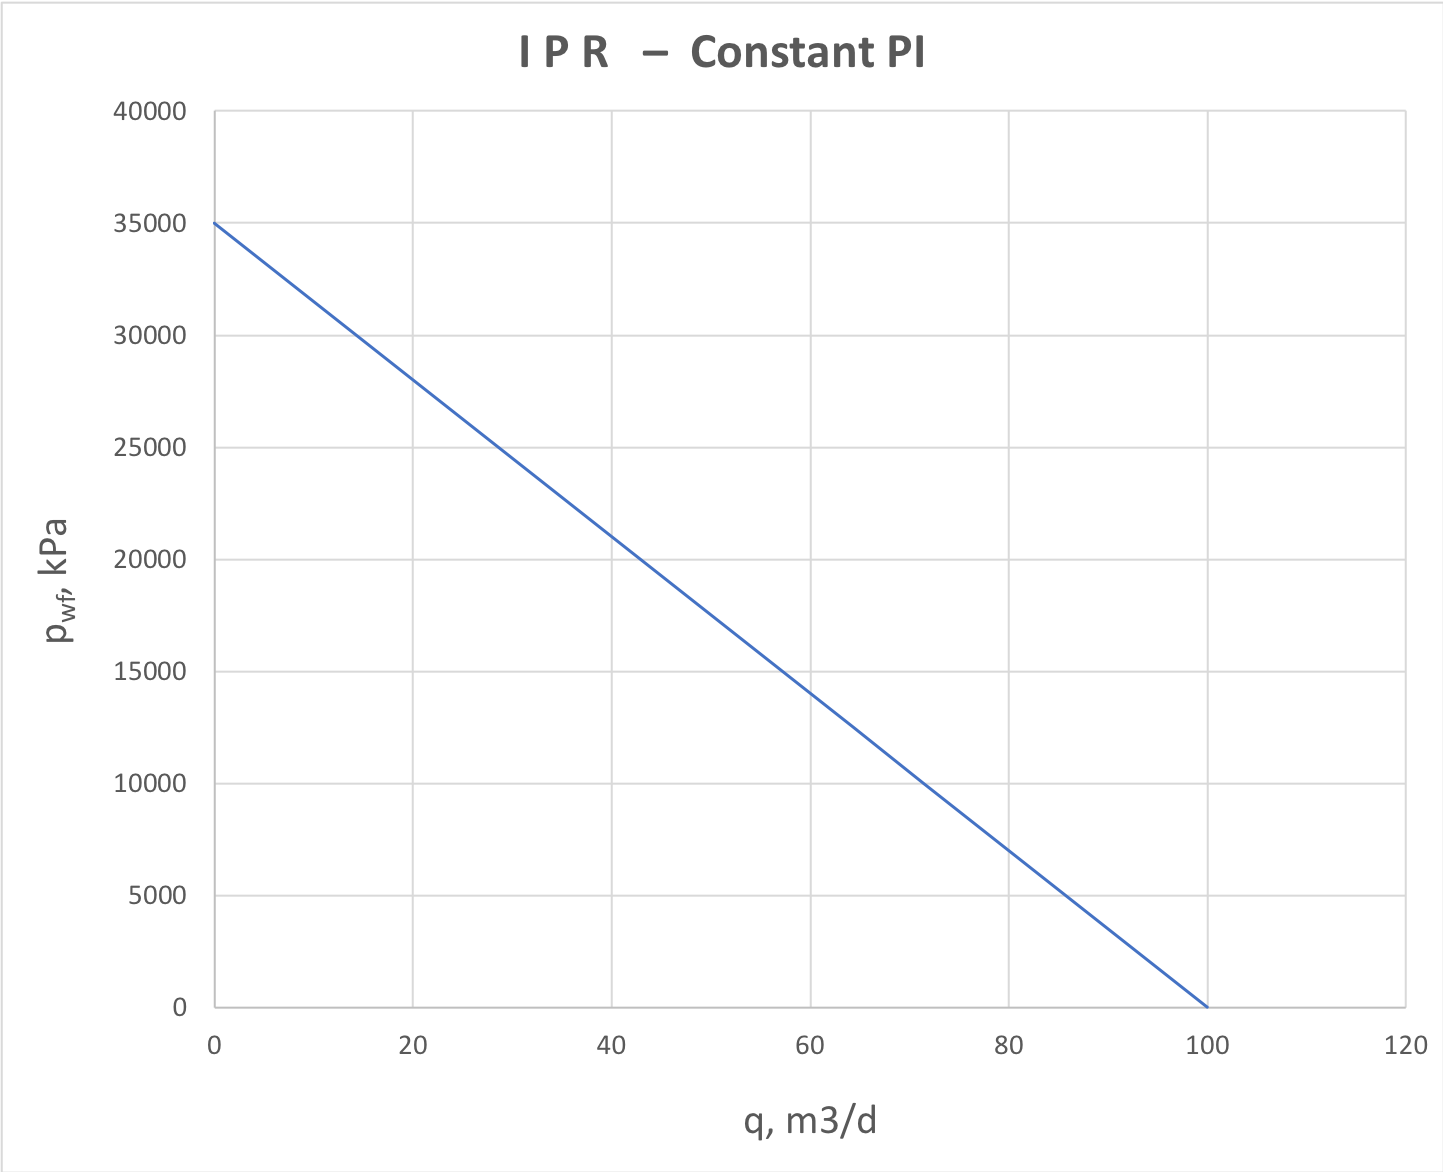
This is a typical IPR plot for water supply wells, water injectors and dead oil producers.
...
For gas producers, the fluid compressibility is high and formation flow is essentially non-linear, inflicting the downward trend on the whole IPR plot (Fig. 2).
|
Fig. 2. IPR for dry gas producer or gas injector into a gas formation |
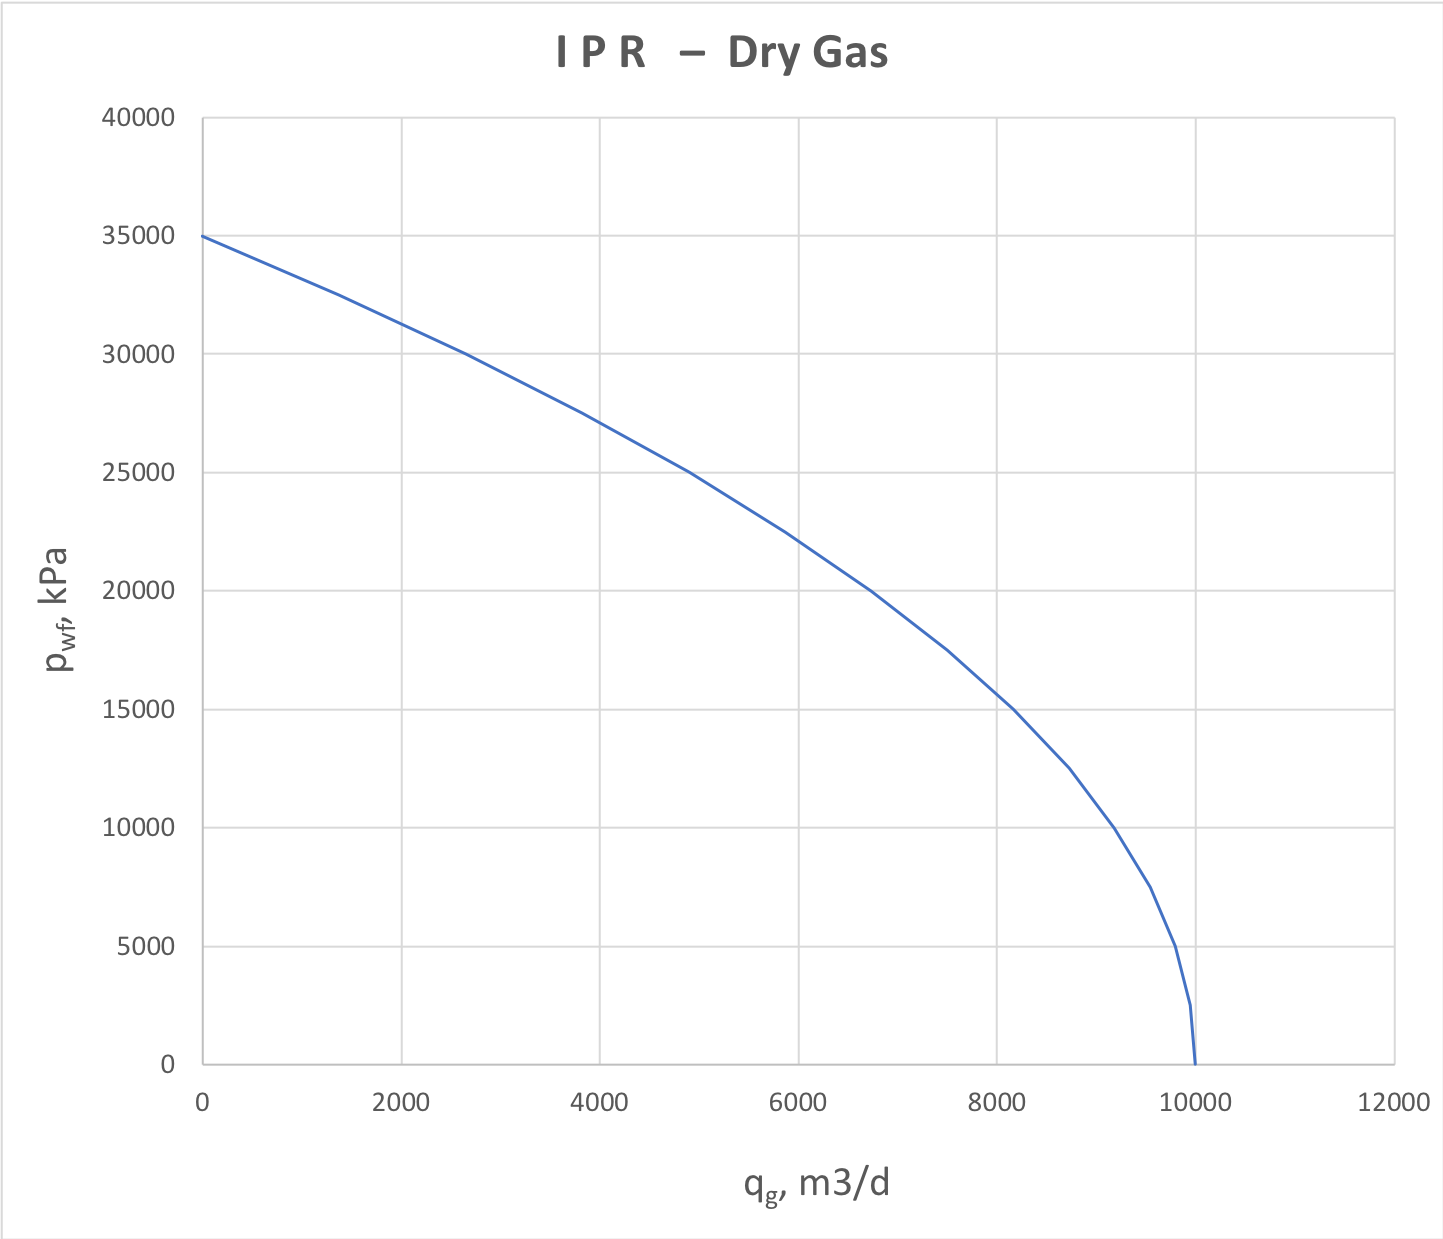
The popular dry gas IPR correlation is Rawlins and Shellhardt:
...
For saturated oil reservoir the free gas flow inflict the downward trend of IPR plot similar to dry gas (Fig. 3).
|
Fig. 3. IPR for 2-phase oil+gas production below and above bubble point |
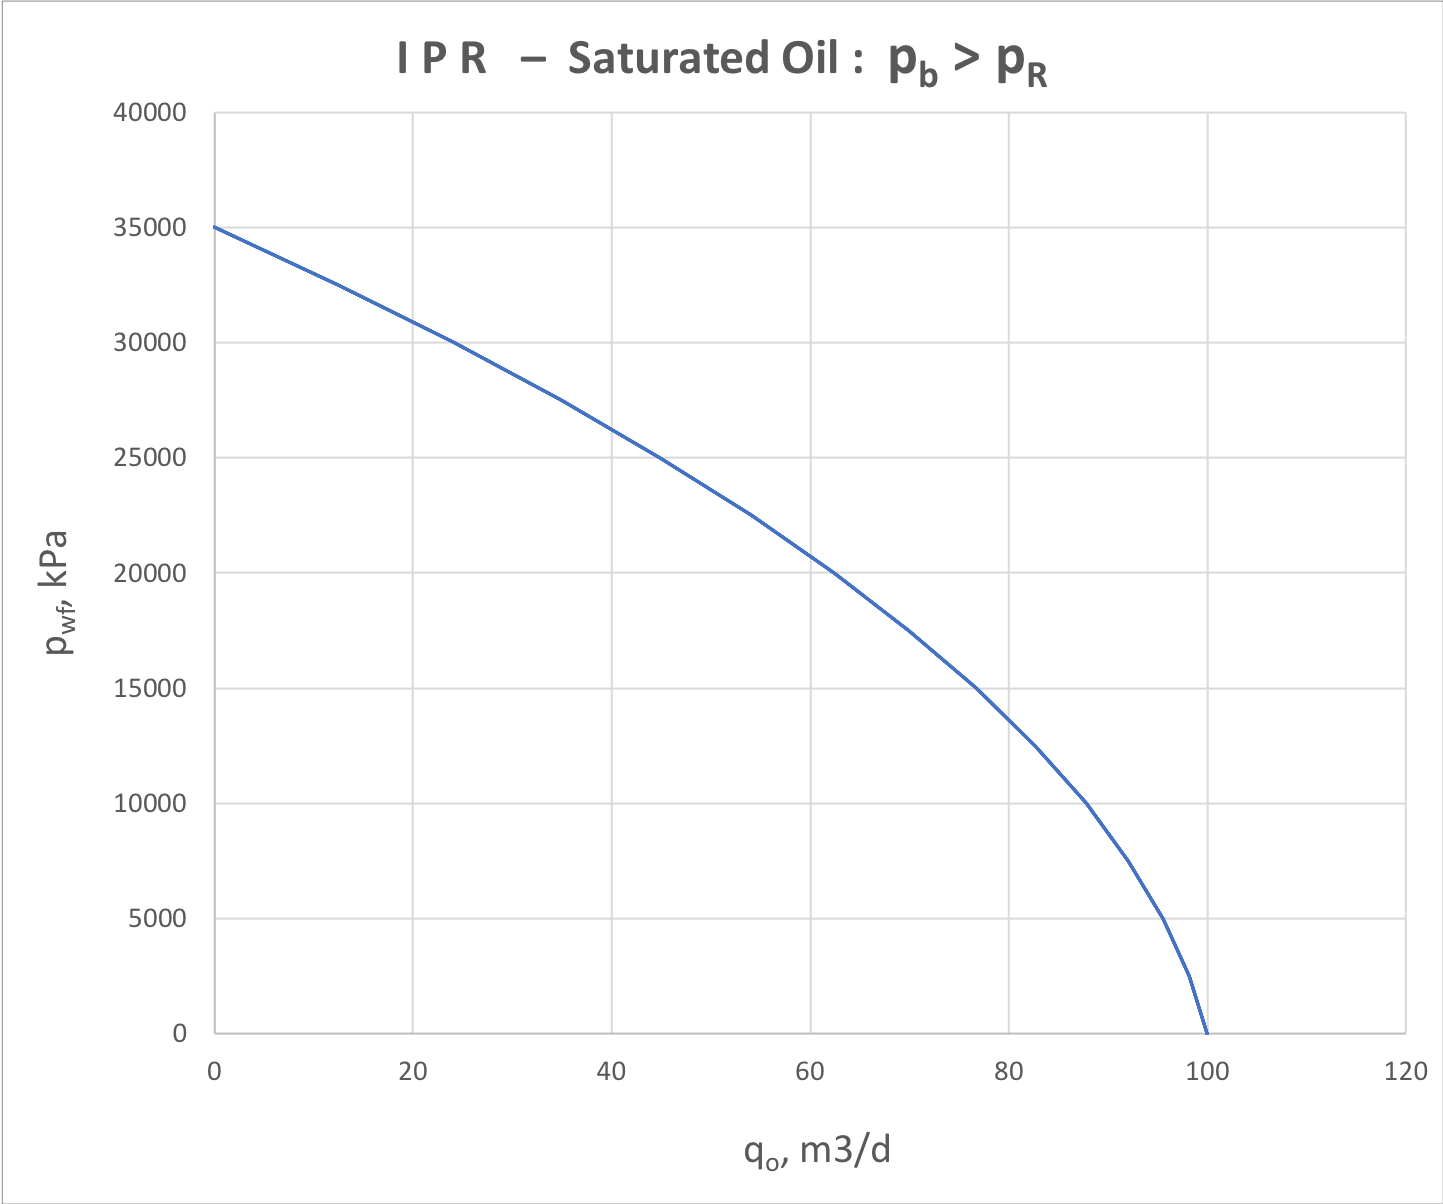
The analytical correlation for saturted oil flow is given by Vogel model:
| Excerpt Include | ||||||
|---|---|---|---|---|---|---|
|
| LaTeX Math Block | ||||
|---|---|---|---|---|
| ||||
\frac{q}{q_{max}} = 1 - 0.2 \, \frac{p_{wf}}{p_r} - 0.8 \Bigg(\frac{p_{wf}}{p_r} \Bigg)^2 \quad , \quad p_b > p_r > p_{wf} |
...
It can be interpreted as deterioration of near-reservoir zone permeability when the fluid velocity is high and approximated by rate-dependant skin-factor.
|
Fig. 3. IPR for 2-phase oil+gas production below and above bubble point |
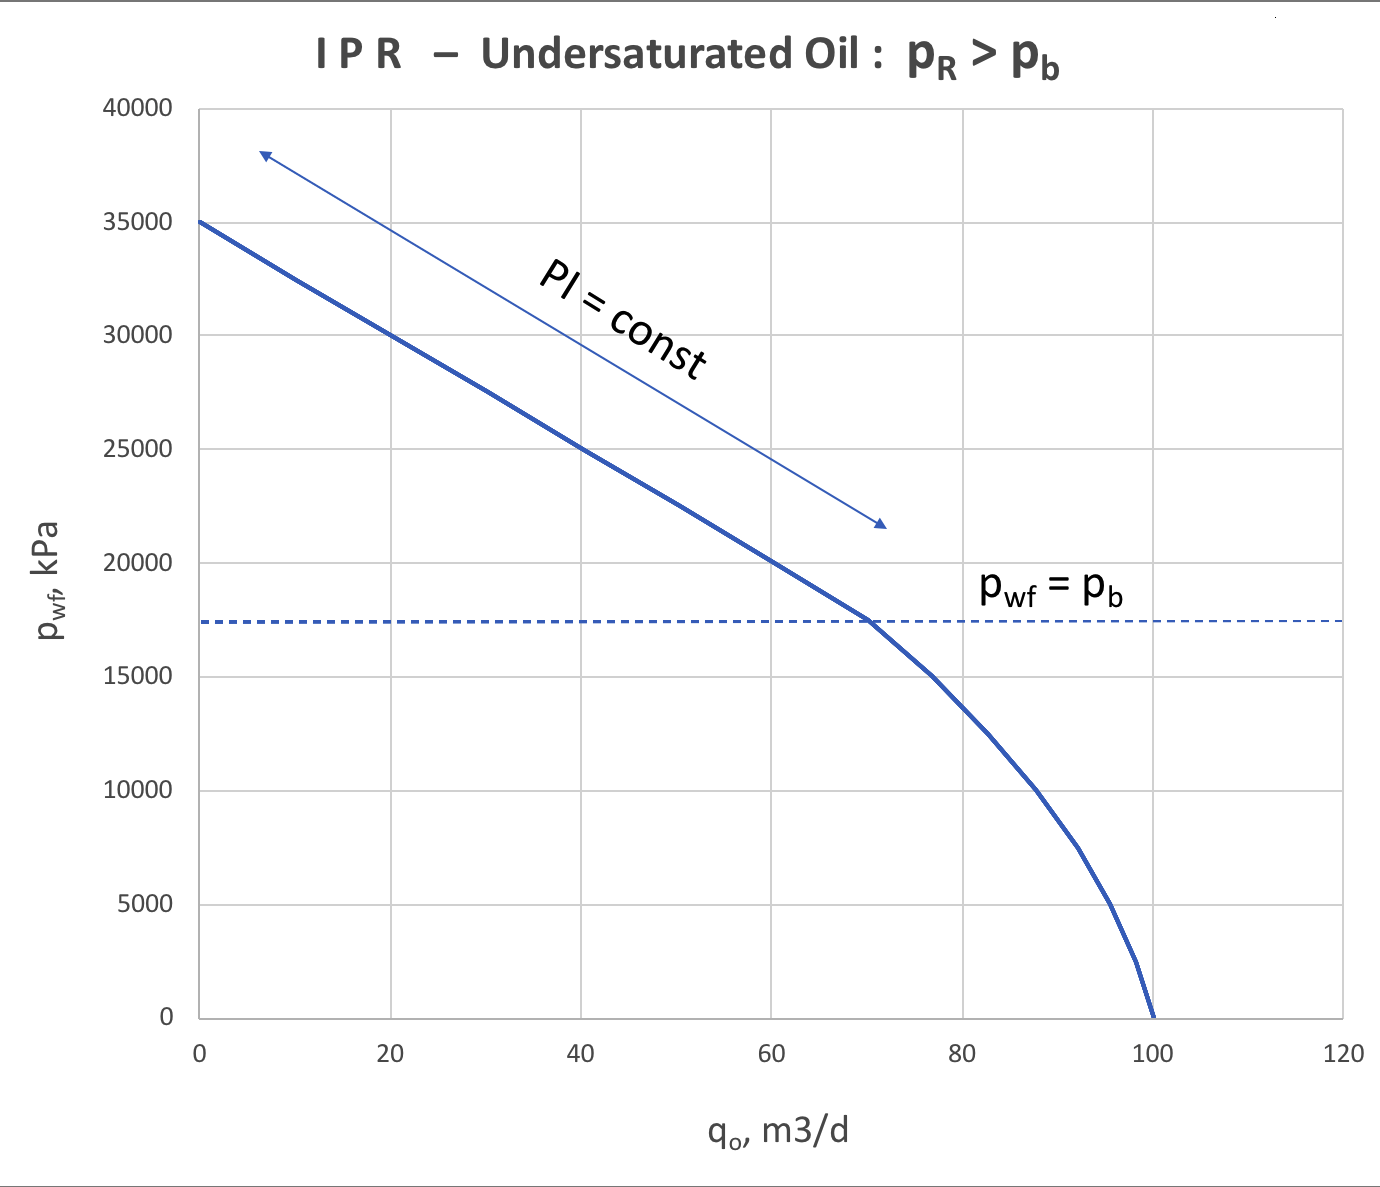
The analytical correlation for undersaturated oil flow is given by modified Vogel model:
...
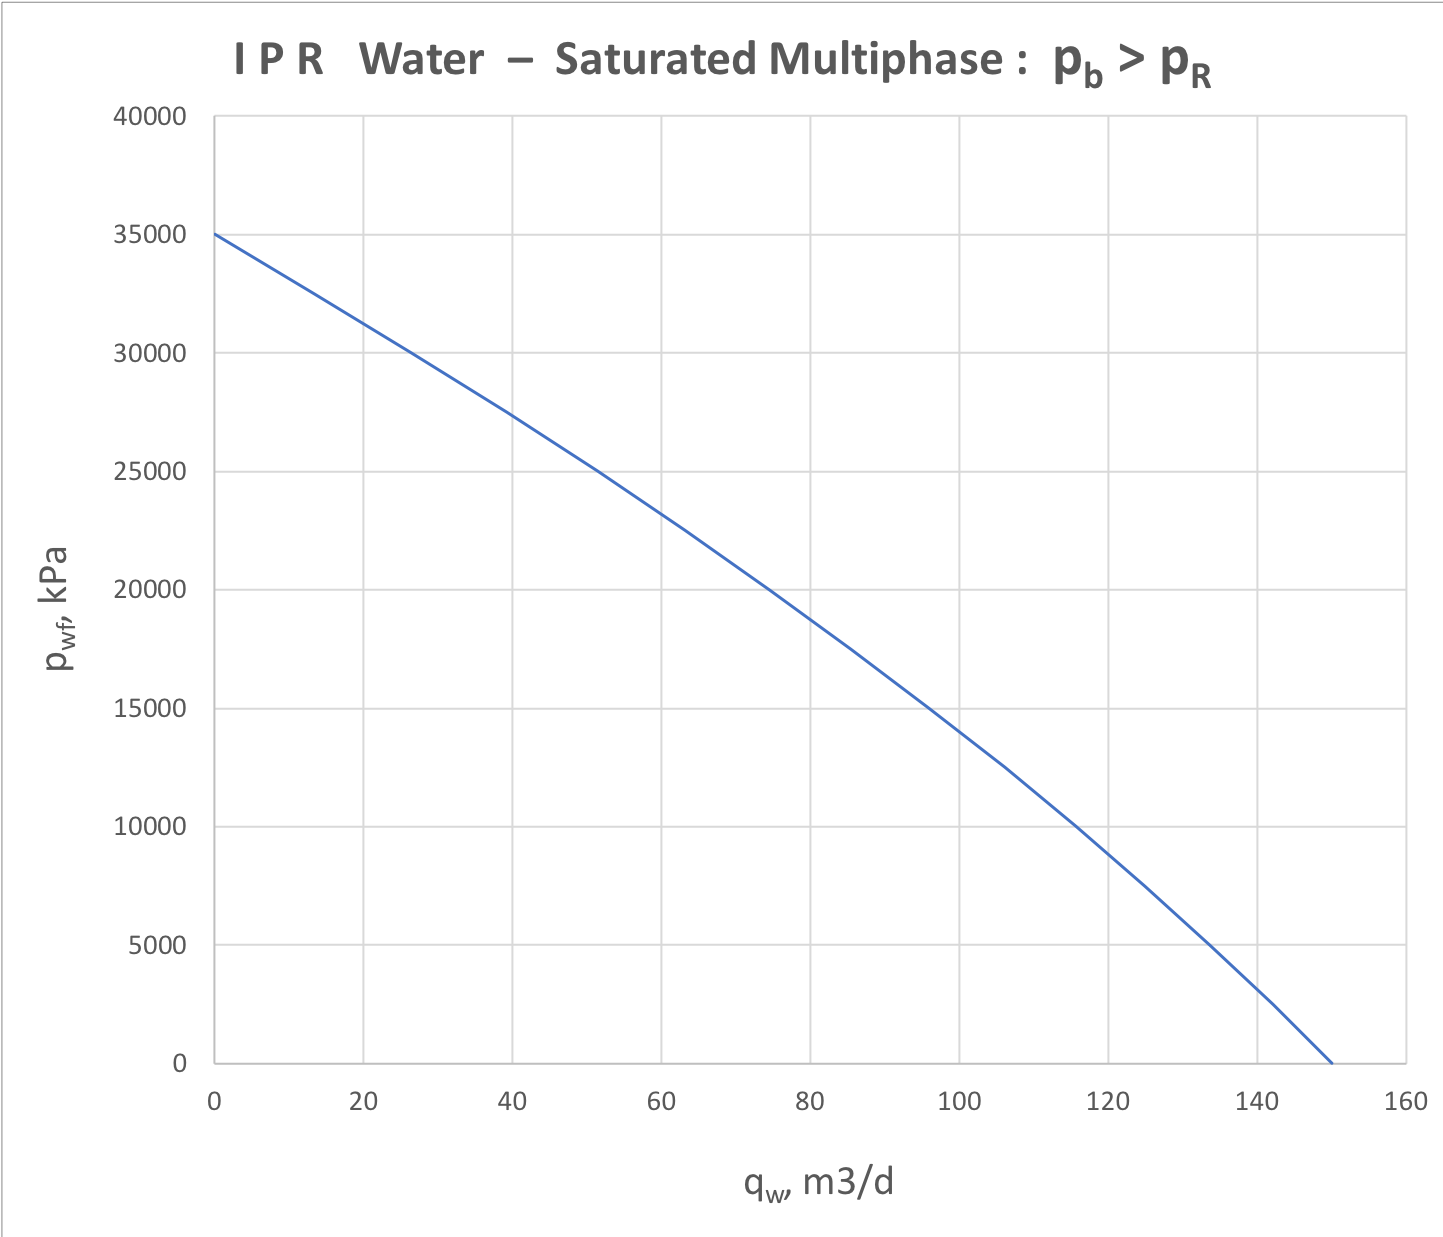
For saturated 3-phase water-oil-gas reservoir the IPR analysis is represented by oil and water components separately (see Fig. 4.1 and Fig. 4.2).
|
|
Fig. 4.1. Oil IPR for saturated 3-phase (water + oil + gas) formation flow | Fig. 4.2. Water IPR for saturated 3-phase (water + oil + gas) formation flow |
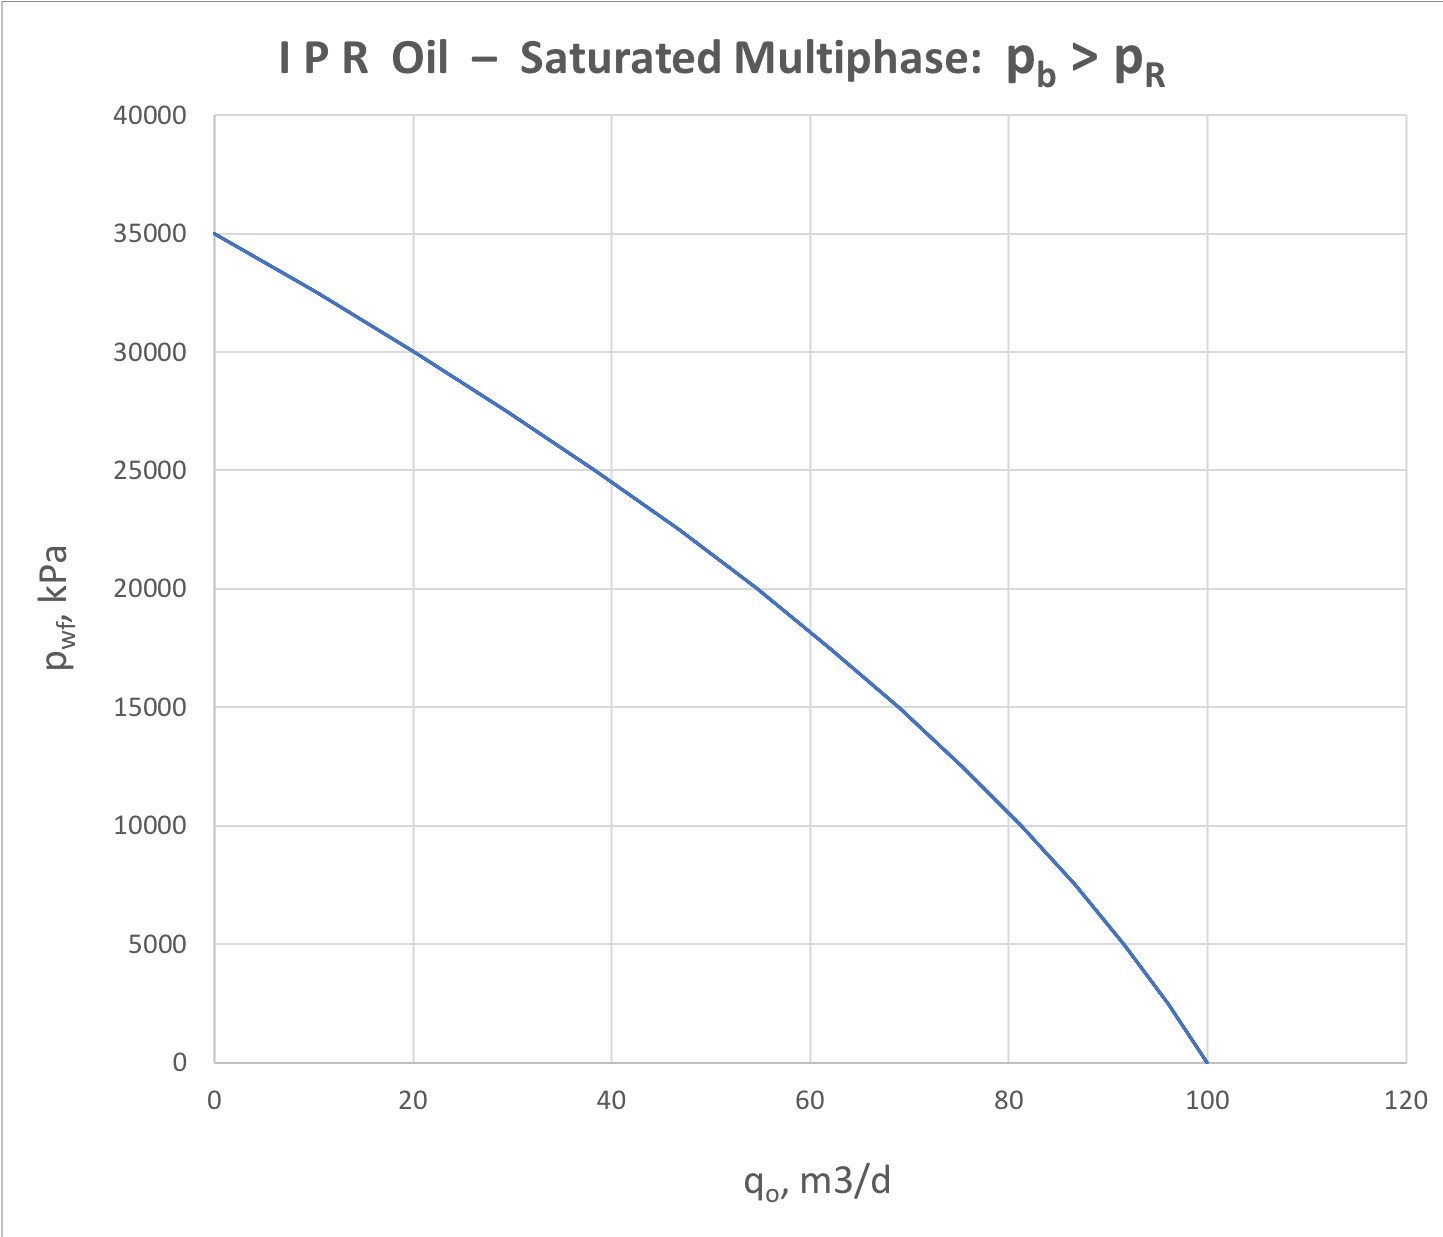
The analytical correlation for saturated 3-phase oil flow is given by Wiggins model:
...
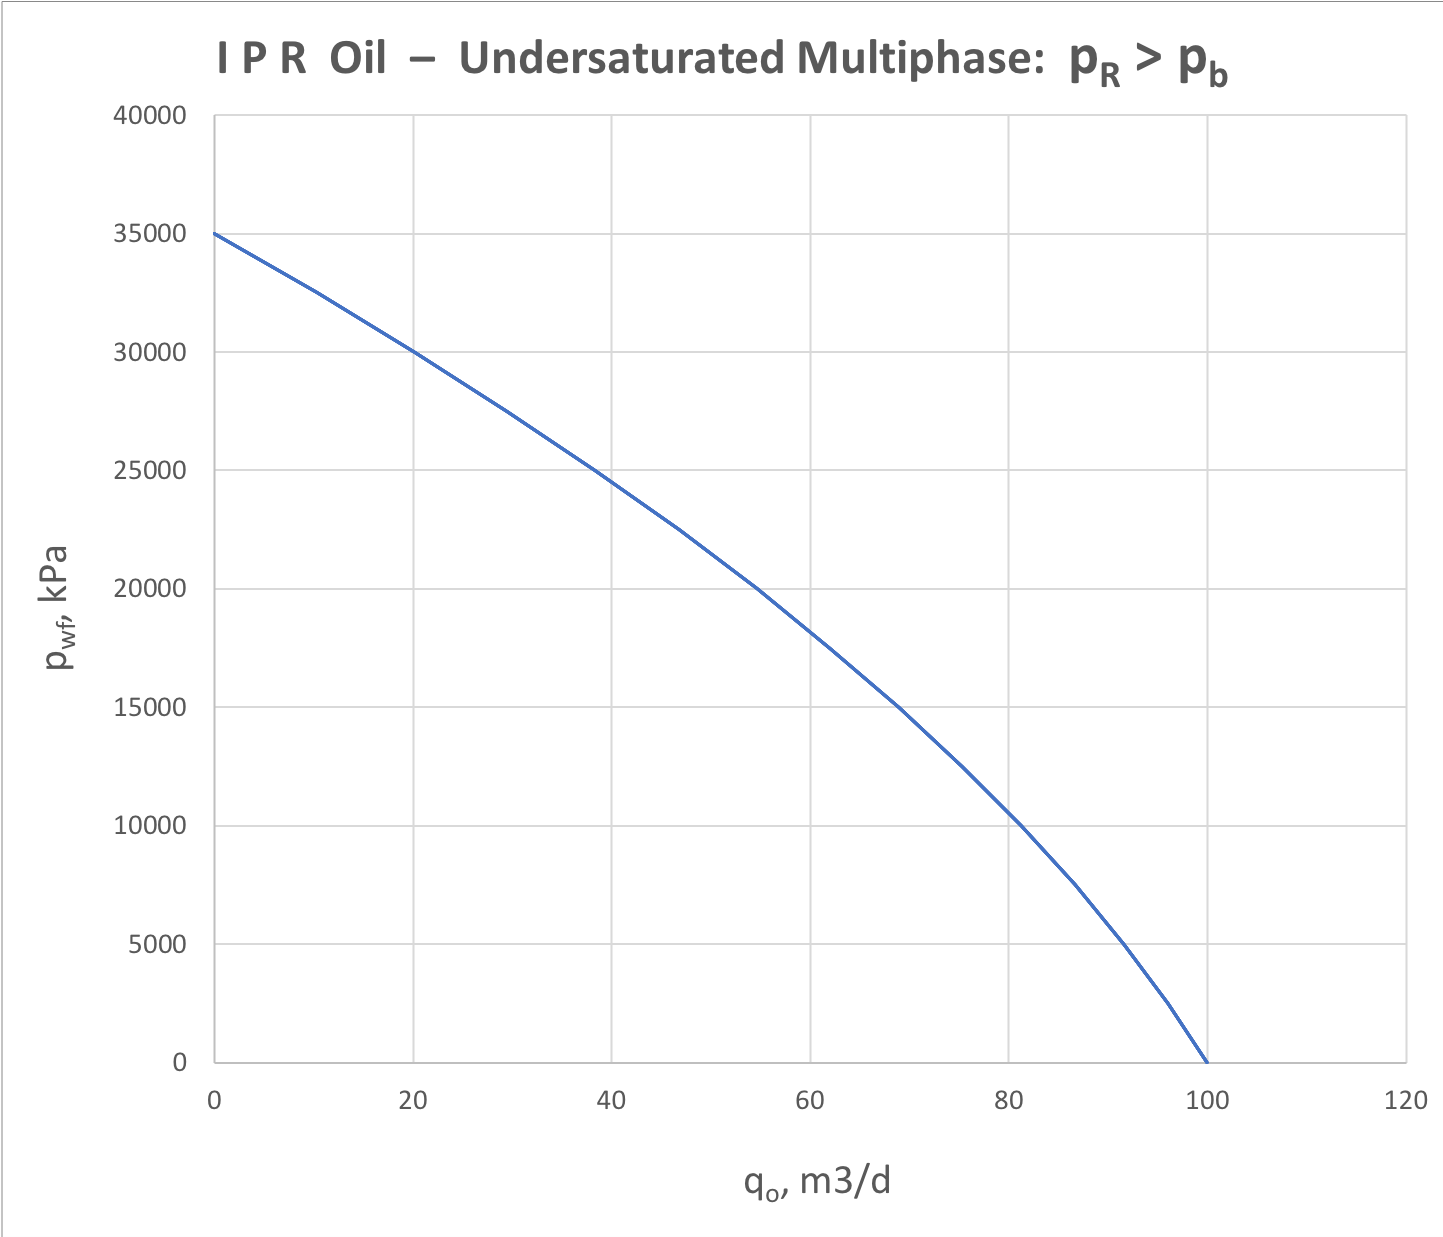
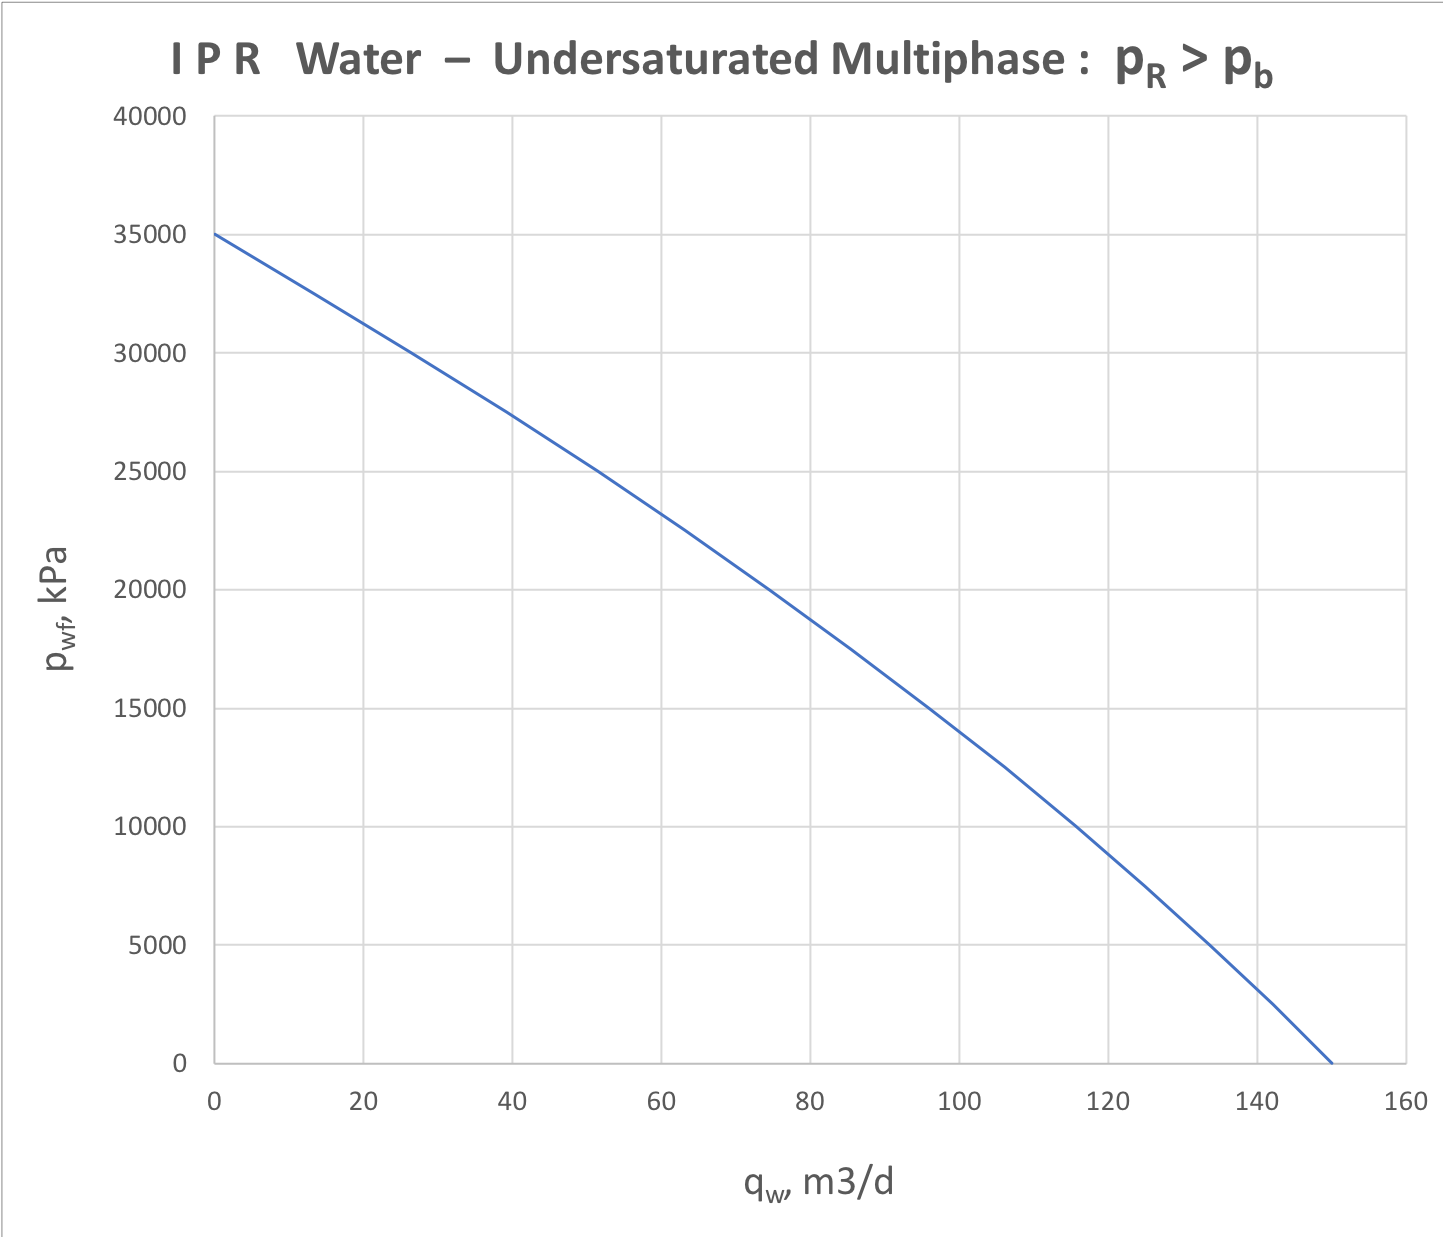
For undersaturated 3-phase water-oil-gas reservoir the IPR analysis is represented by oil and water components separately (see Fig. 4.1 and Fig. 4.2).
|
|
Fig. 4.1. Oil IPR for udersaturated 3-phase (water + oil + gas) formation flow | Fig. 4.2. Water IPR for undersaturated 3-phase (water + oil + gas) formation flow |
| Show If | ||||||||||||||
|---|---|---|---|---|---|---|---|---|---|---|---|---|---|---|
| ||||||||||||||
The analytical correlation for saturated 3-phase oil flow is given by Wiggins model:
|
...