It is characterized by critical temperature
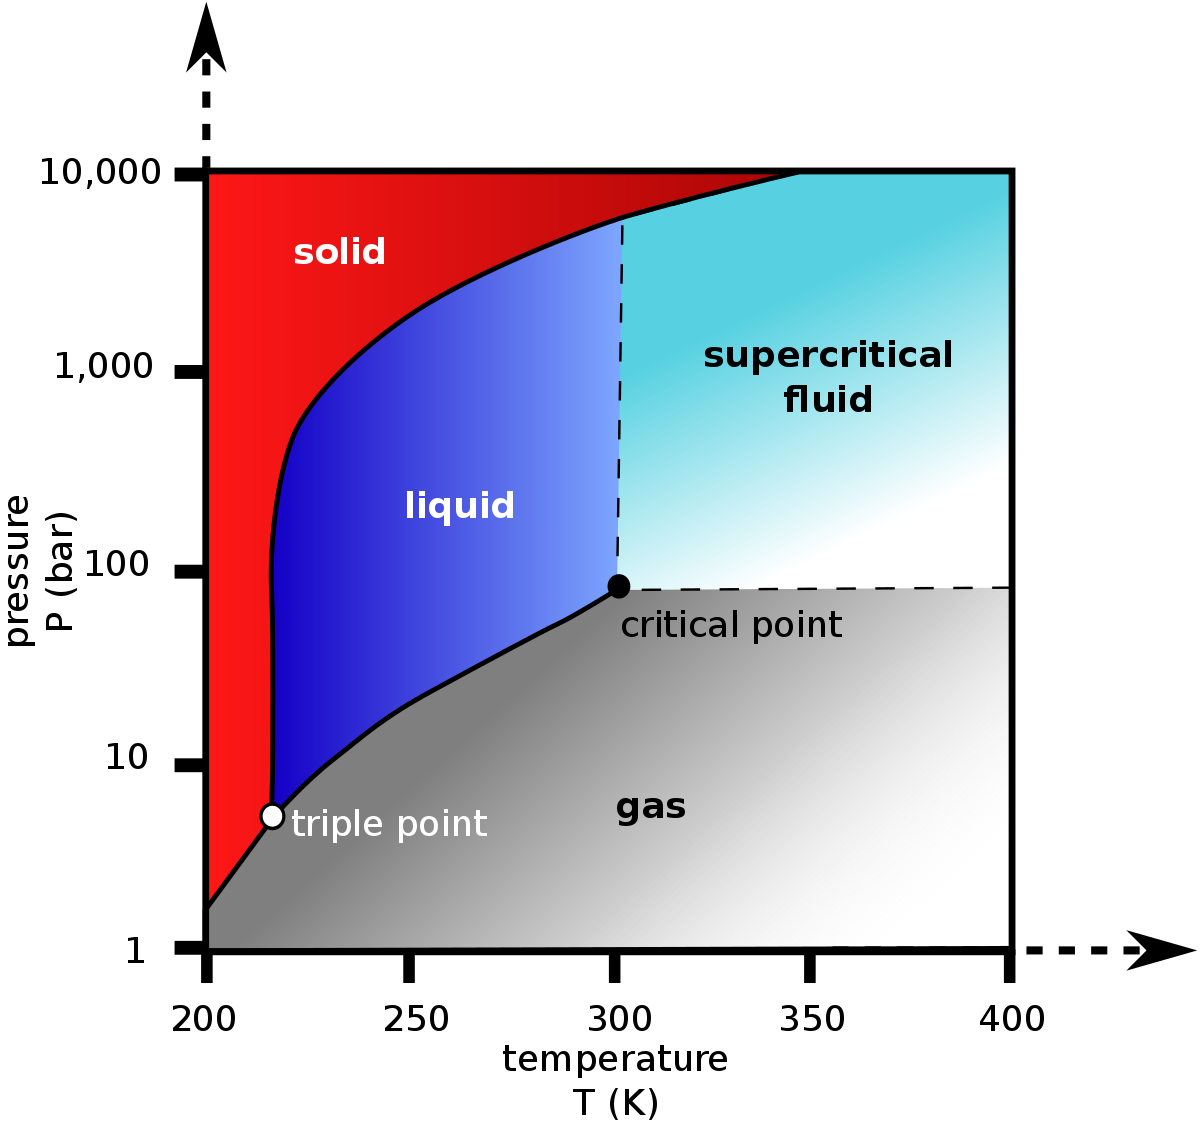
The apex point of Vapour Liquid Equilibrium (VLE) area on PT diagram of Fluid Mixture (see Fig. 1).
It is characterized by critical temperature and critical pressure
.
|
| Fig. 1. Schematic PT diagram with Vapour Liquid Equilibrium and Pseudo-Critical Point (Tpc, ppc). |
The simplest estimate of Pseudo-Critical Point is the mole fraction weighted average:
T_{pc} = \sum_i x_i \, T_{c,i} |
p_{pc} = \sum_i x_i \, p_{c,i} |
where
mole fraction of the | |
critical temperature of the | |
critical pressure of the |
Natural Science / Physics / Thermodynamics / Thermodynamic system
[ Fluid Mixture ]
[ Pseudo-Critical Point (Tpc, ppc) ][ Pseudo-Critical Temperature (Tpc) ][ Pseudo-Critical Pressure (Ppc)]
[ Critical Point (Tc, pc) ][ Сritical Temperature Tc ][ Critical Pressure (pc) ]