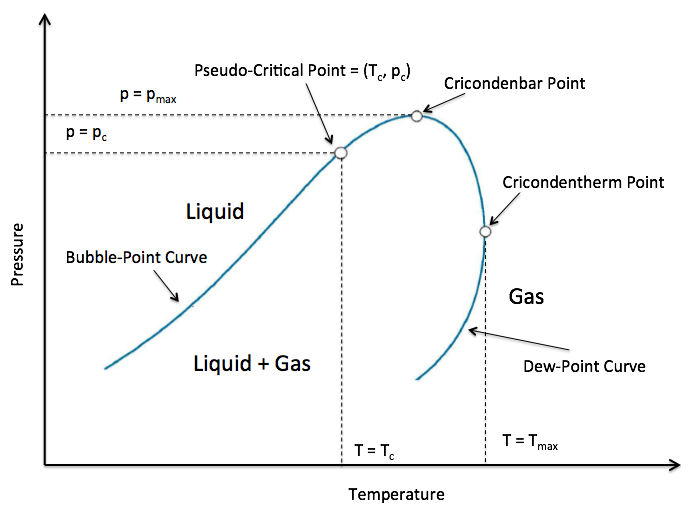
The junction point of Vapour Liquid Equilibrium (VLE) area on PT diagram of Fluid Mixture (see Fig. 1).
It is characterized by pseudo-critical temperature
T_{pc} and pseudo-critical pressure
p_{pc}.
|
| Fig. 1. Schematic PT diagram with Vapour Liquid Equilibrium and Pseudo-Critical Point (Tpc, ppc). |
The simplest estimate (also called Linear Blending Rule) of Pseudo-Critical Point
( T_{pc}, \, p_{pc} ) is the mole fraction weighted average of the critical temperature
\{ T_{c, i} \} and critical pressure
\{ p_{c, i} \} of fluid components (which are pure substances) :
| (1) | T_{pc} = \sum_i x_i \, T_{c,i} |
| (2) | p_{pc} = \sum_i x_i \, p_{c,i} |
where
x_i | mole fraction of the i-th mixture component |
T_{c,i} | critical temperature of the i-th mixture component |
p_{c,i} | critical pressure of the i-th mixture component |
There are other no-linear methods to blend the components to estimate the Pseudo-Critical Point but many engineering applications use
(1) and
(2) as the seed and then fit the values to match lab test data.
In case the fluid composition is not known one can use empirical Pseudo-Critical Point Correlations to assess the Pseudo-Critical Point.
See also
Natural Science / Physics / Thermodynamics / Thermodynamic system
[ Fluid Mixture ]
[ Pseudo-Critical Point (Tpc, ppc) ][ Pseudo-Critical Temperature (Tpc) ][ Pseudo-Critical Pressure (Ppc)][ Pseudo-Critical Point Correlations @model ]
[ Critical Point (Tc, pc) ][ Сritical Temperature (Tc) ][ Critical Pressure (pc) ]