...
|
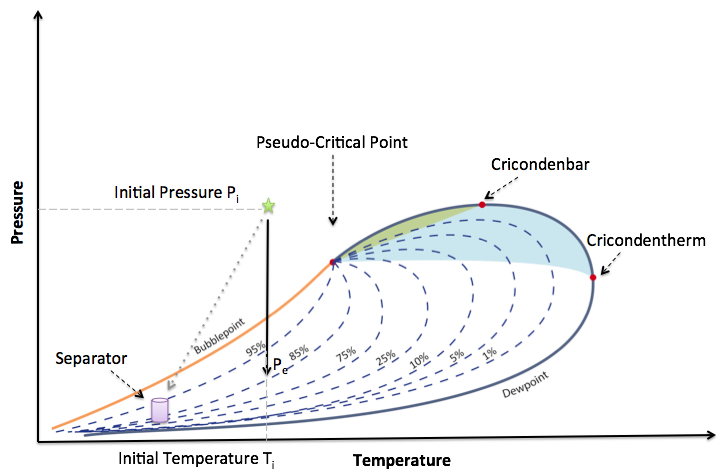
Fig. 1. Production path of the Black Oil Reservoir on the Phase Equilibrium Diagram. The dash lines showing the Vapour Quality Lines (with inverse numbering). The downward solid black arrow shows a reservoir pressure depletion path. The downward grey dash arrow shows a wellbore lift pressure drop path. |
...