...
|
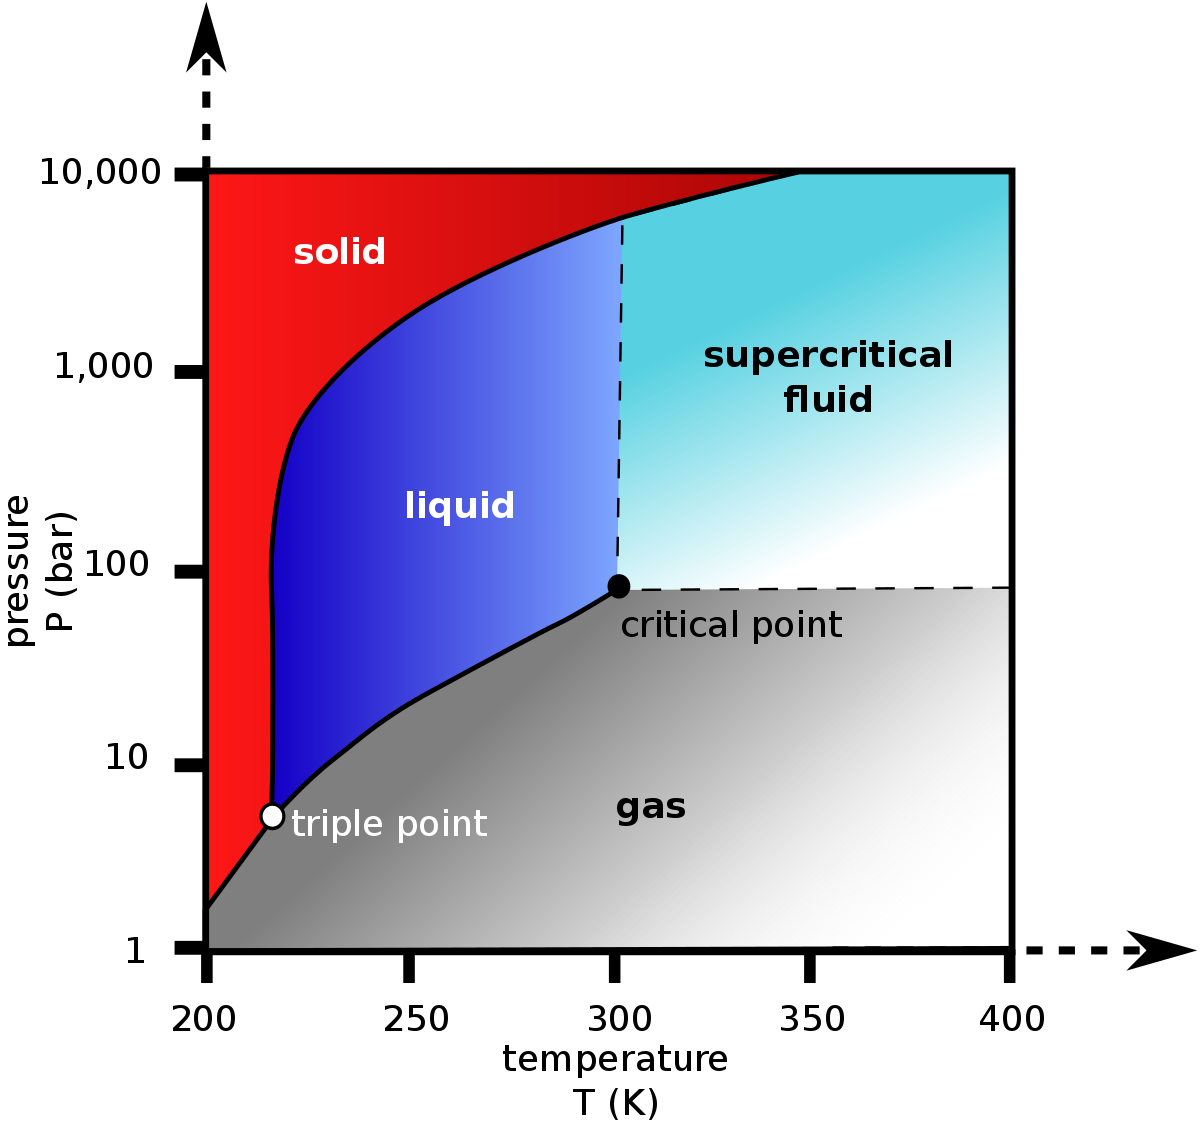
| Fig. 1. Schematic PT diagram with Vapour Liquid Equilibrium and Pseudo-Critical Point (Tpc, ppc). |
The simplest estimate of Pseudo-Critical Point
is the mole fraction weighted average:LaTeX Math Inline body --uriencoded--( T_%7Bpc%7D, \, p_%7Bpc%7D )
| LaTeX Math Block | ||||
|---|---|---|---|---|
| ||||
T_{pc} = \sum_i x_i \, T_{c,i} |
| LaTeX Math Block | ||||
|---|---|---|---|---|
| ||||
p_{pc} = \sum_i x_i \, p_{c,i} |
where
| mole fraction of the | ||||||||
| critical temperature of the | ||||||||
| critical pressure of the |
See also
...
Natural Science / Physics / Thermodynamics / Thermodynamic system
...