...
|
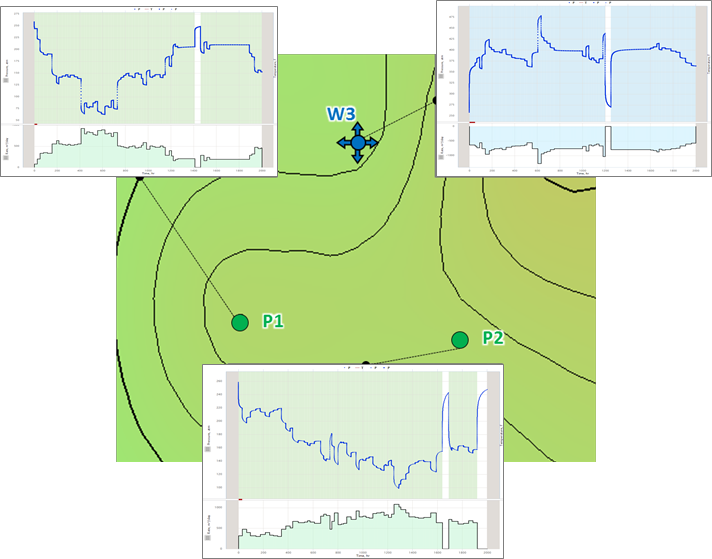
Fig. 1. Well location map |
|
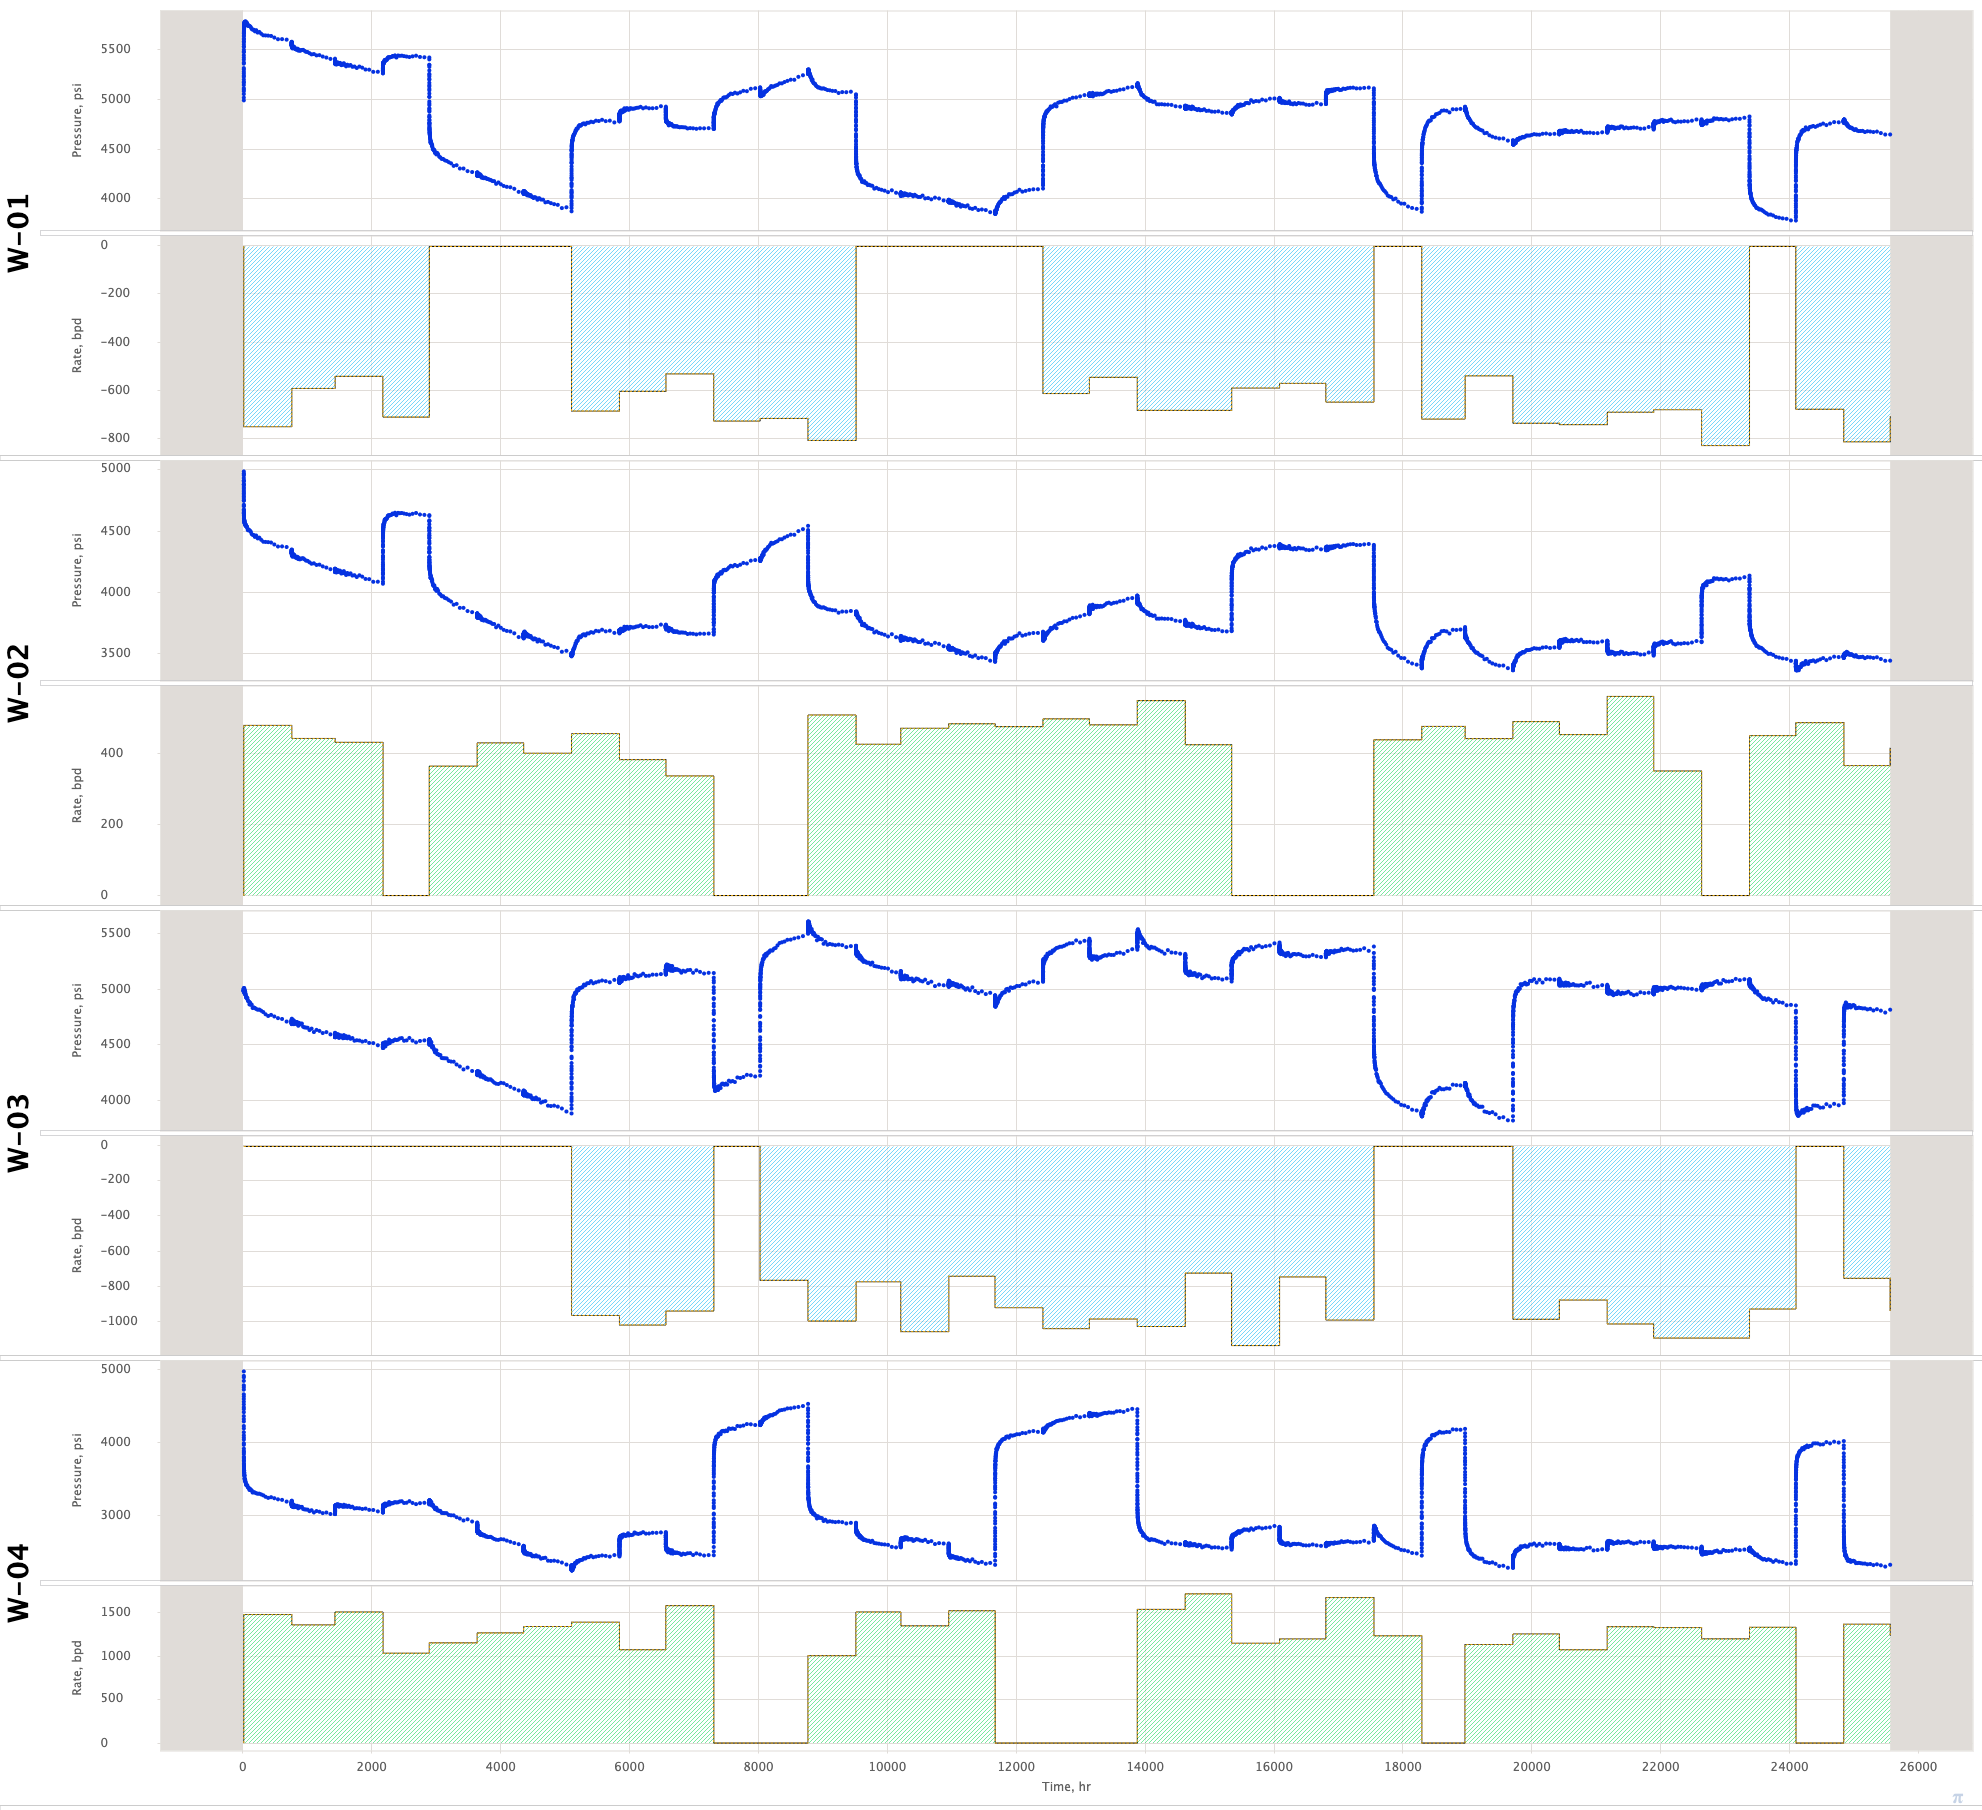
| Fig. 2. Production/Injection History |
|
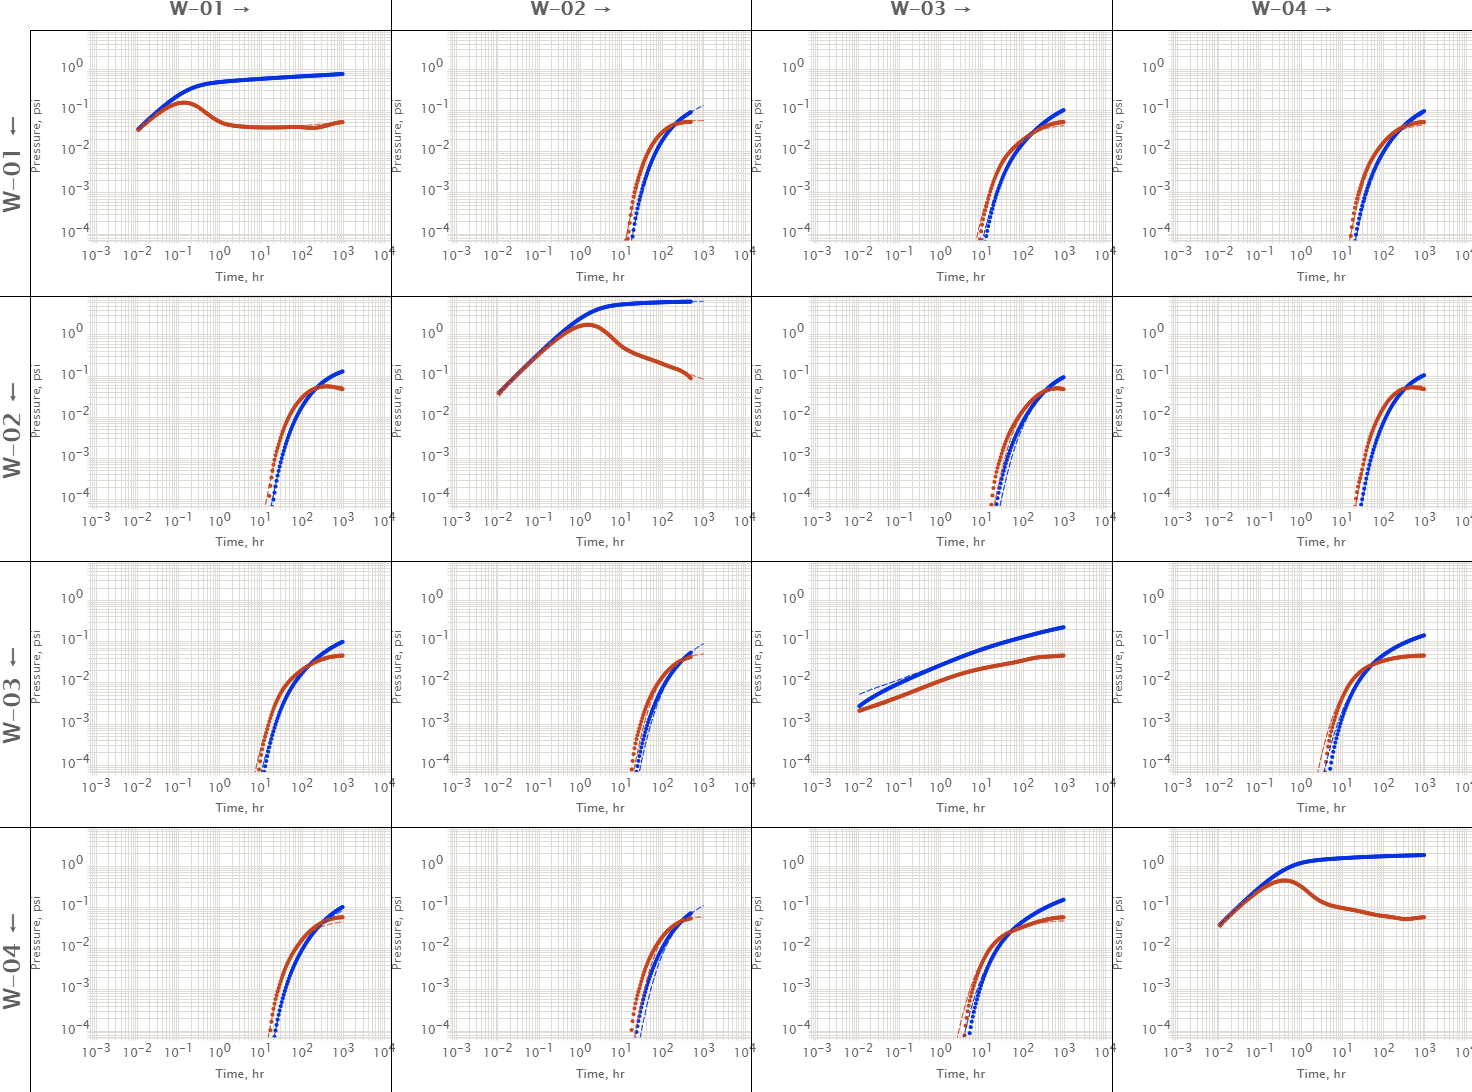
Fig. 3. UTR output diagram from XDCV. The column wells showing pressure response to row wells. Diagonal elements are showing self-response DTRs. Non-diagonal elements showing cross-well response CTRs. |
...