|
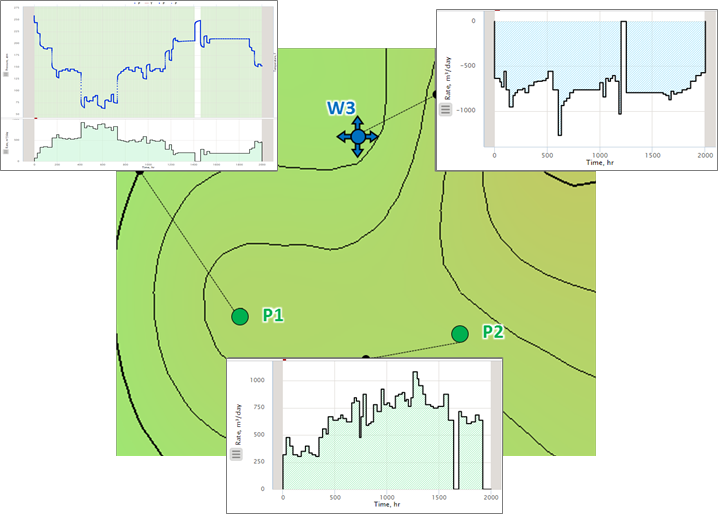
| Fig. 1. Well locations |
|
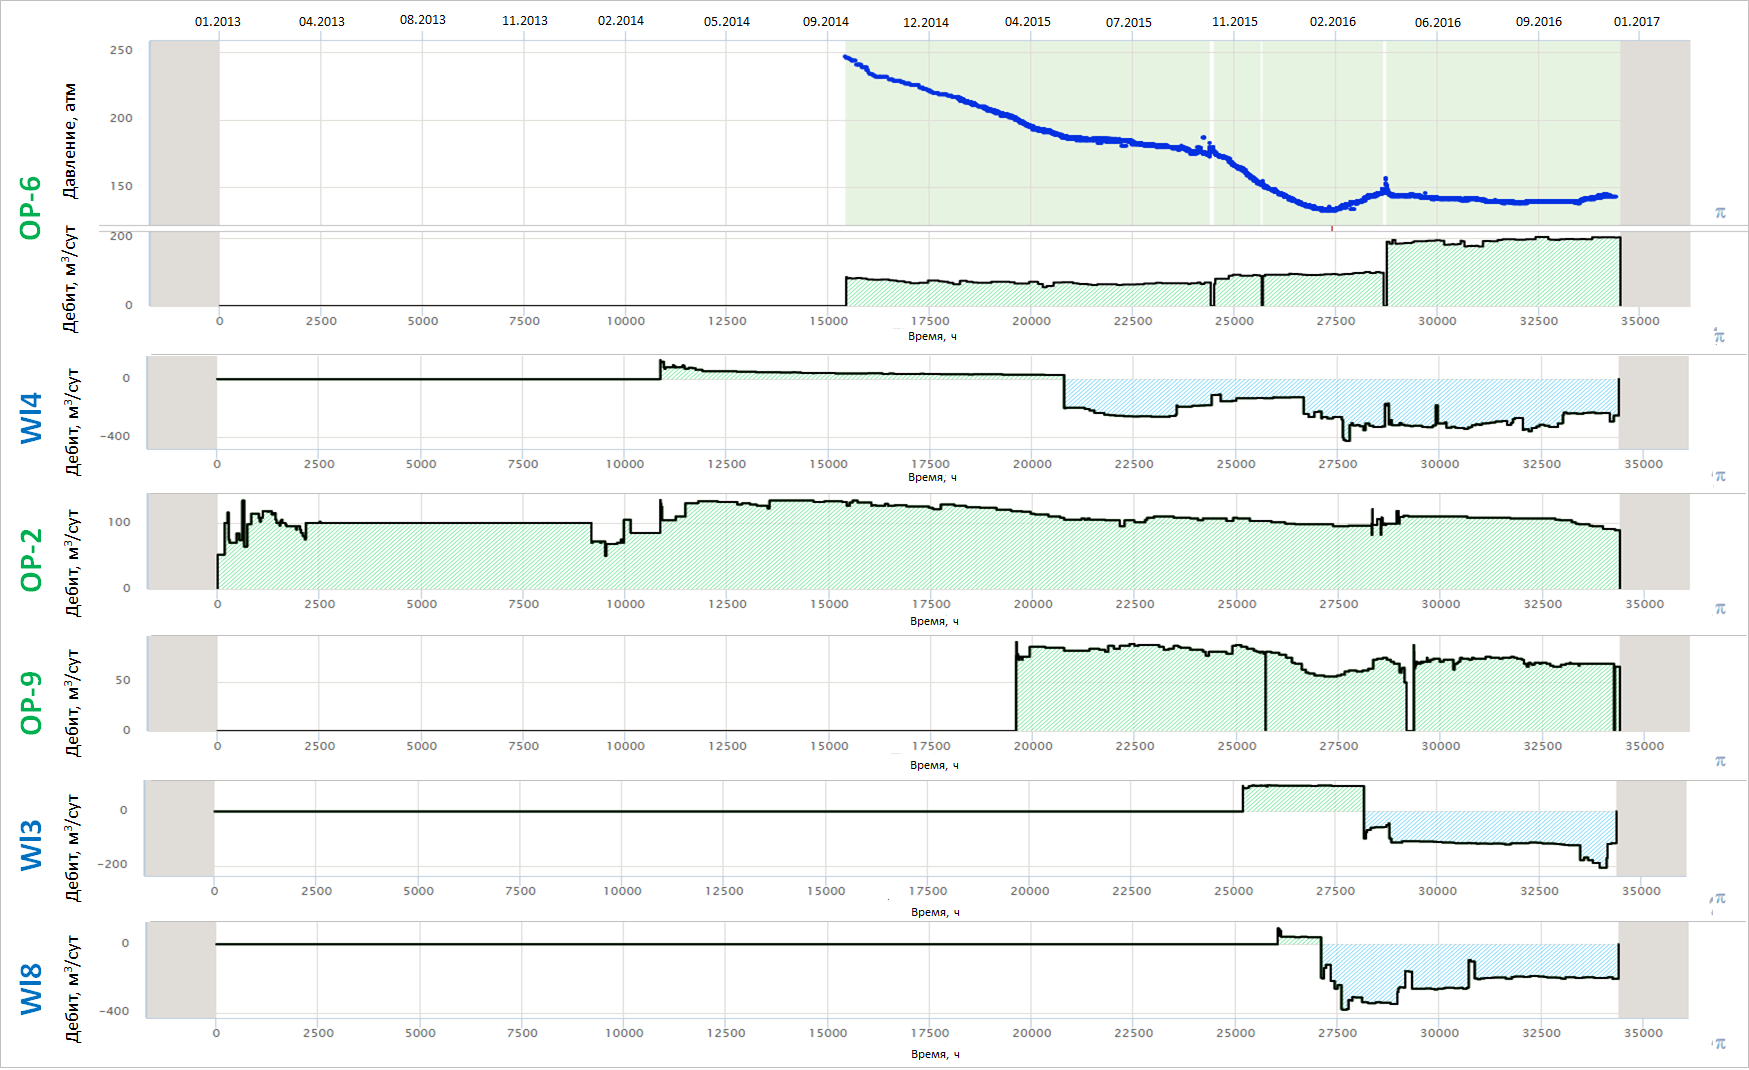
Fig. 2. Production History |
|
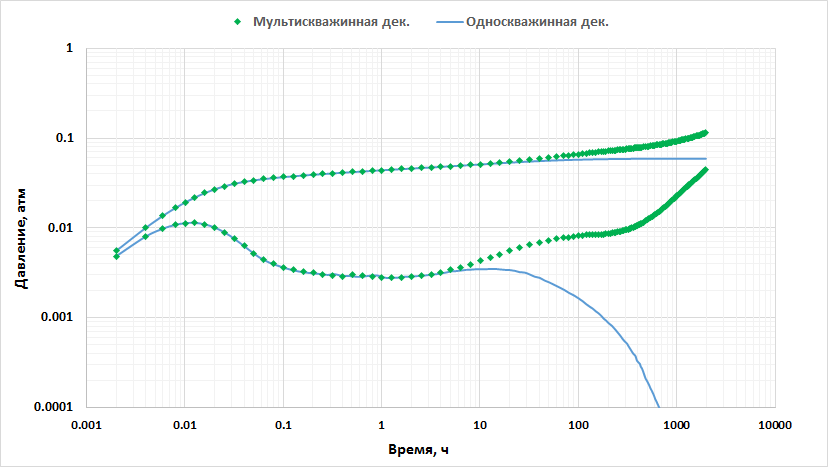
Fig |
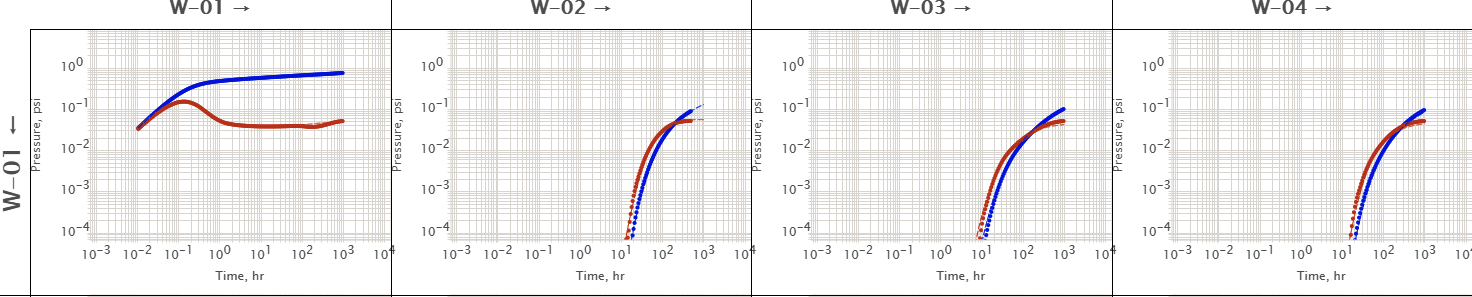
. 3. UTR output diagram from RDCV. The column wells are showing pressure response to row well W-01. The first cell is showing self-response DTR and the other cells showing cross-well response CTRs. |
See also
...
Petroleum Industry / Upstream / Subsurface E&P Disciplines / Production Analysis (PA) / Pressure Deconvolution / Multiwell deconvolution (MDCV) / RDCV