...
See PTA Type Library for a wide range of typical PTA Diagnostic Plots.
|
|

| |
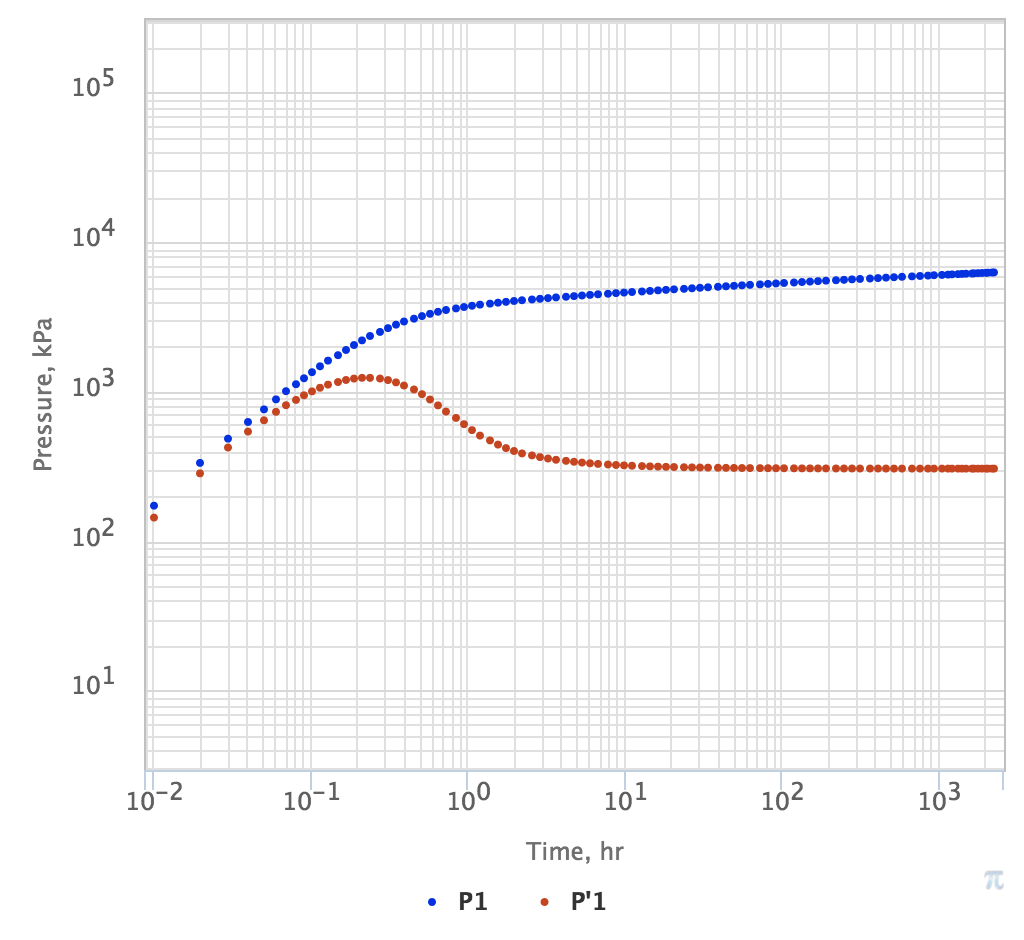
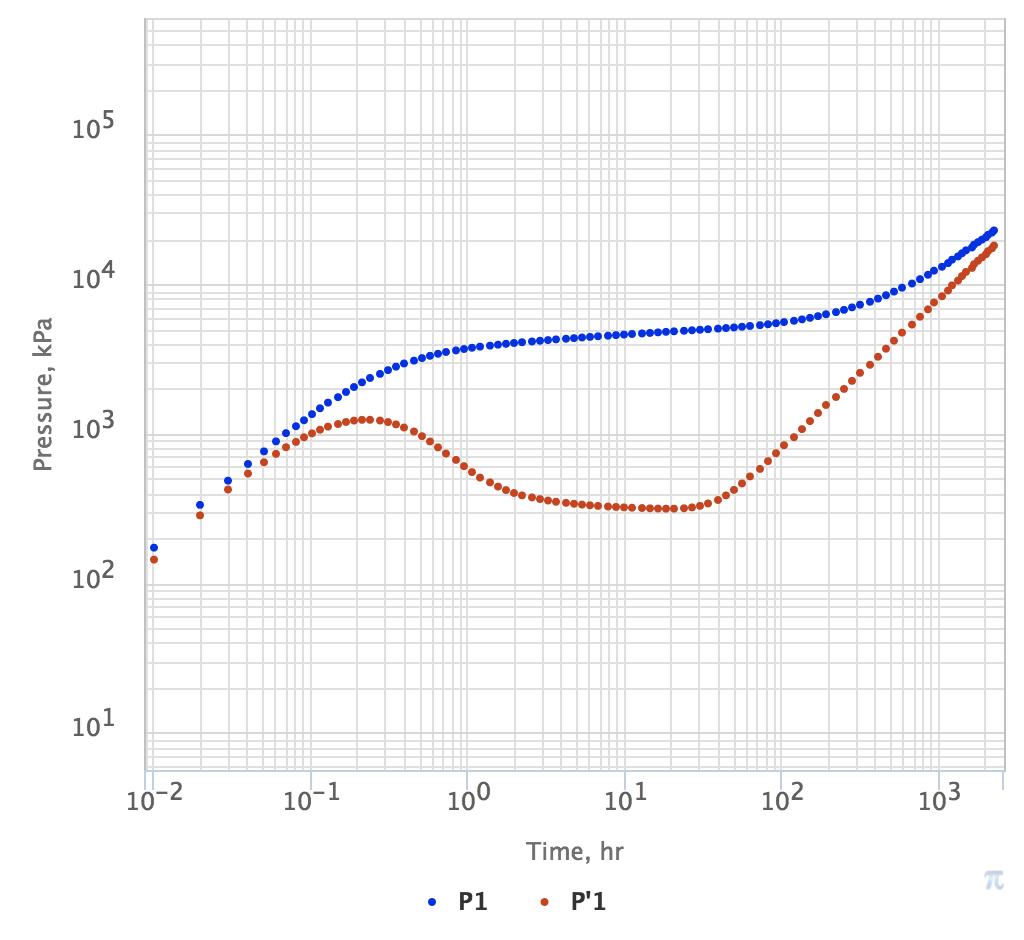
Fig. 1. PTA Diagnostic Plot for vertical well in single-layer homogeneous reservoir without boundaries. Pressure is in blue and log-derivative is in red. | Fig. 2. PTA Diagnostic Plot for vertical well in single-layer homogeneous reservoir |
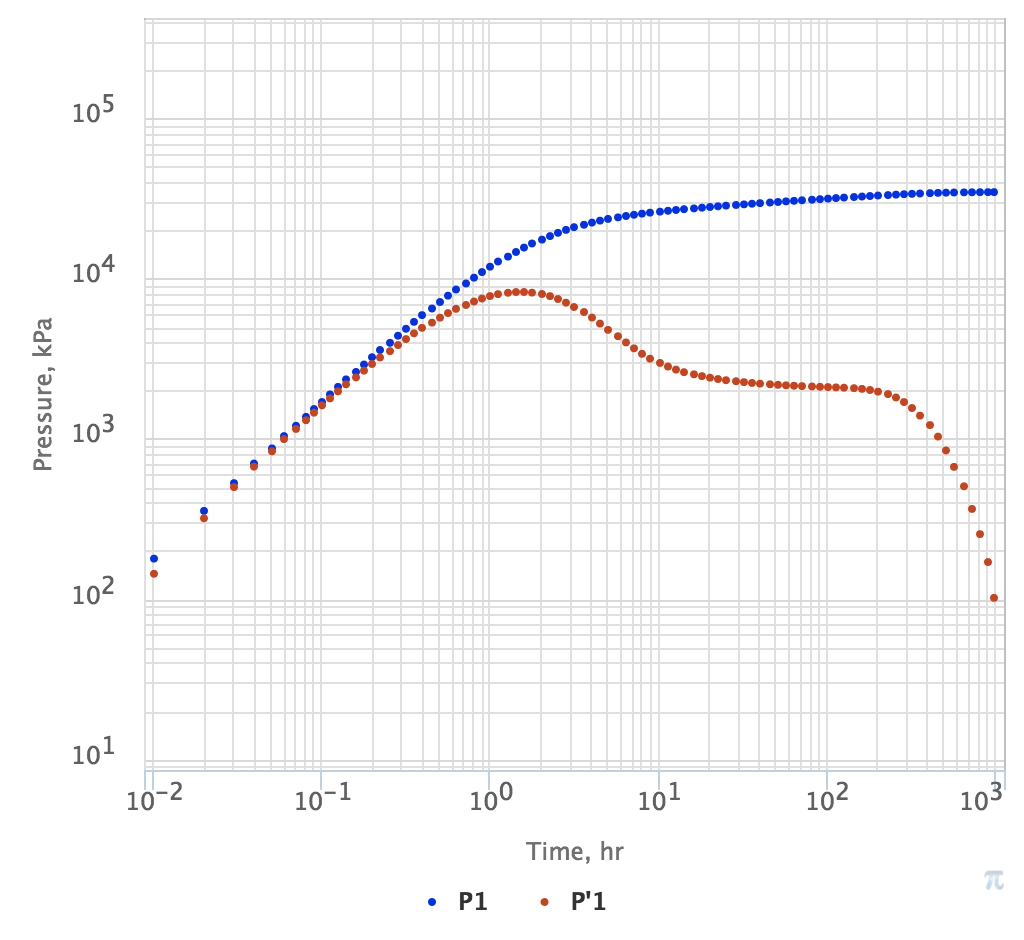
with impermeable circle boundary. Pressure is in blue and log-derivative is in red. | Fig. 3. PTA Diagnostic Plot for vertical well in single-layer homogeneous reservoir with constant pressure boundary. Pressure is in blue and log-derivative is in red. |