...
|
|
|
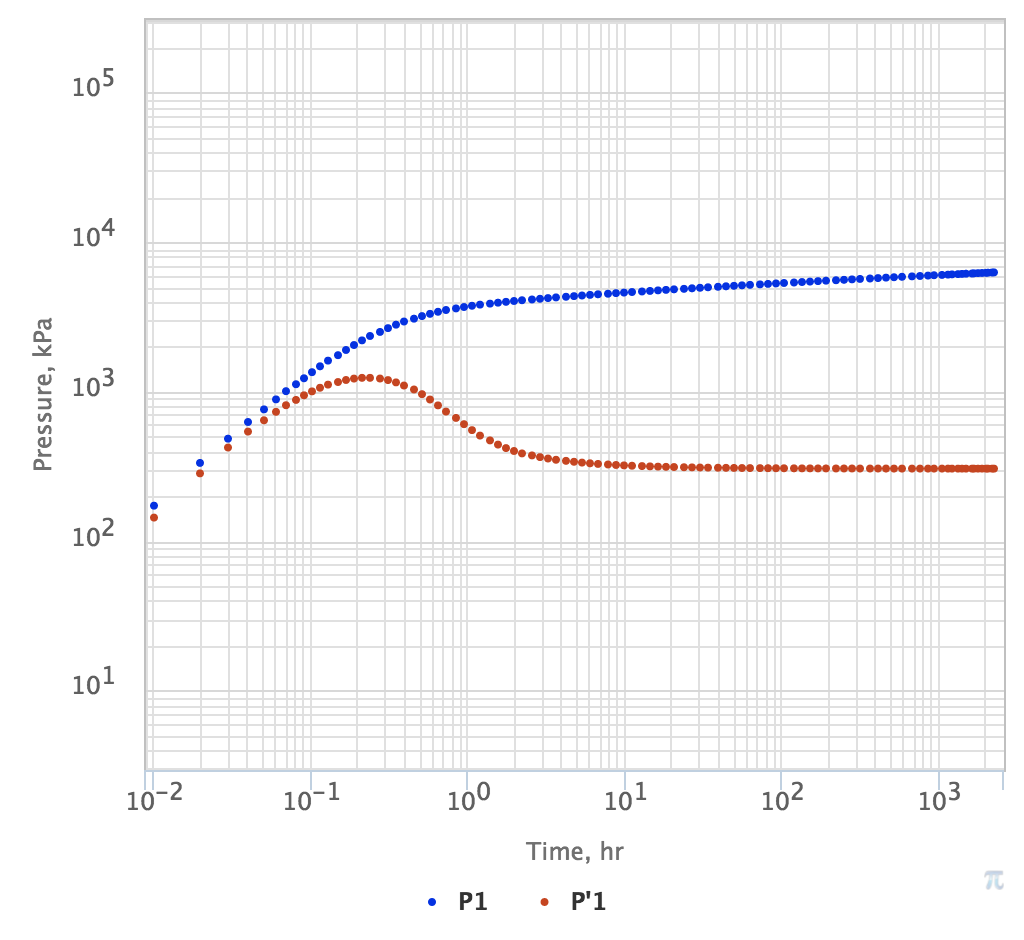
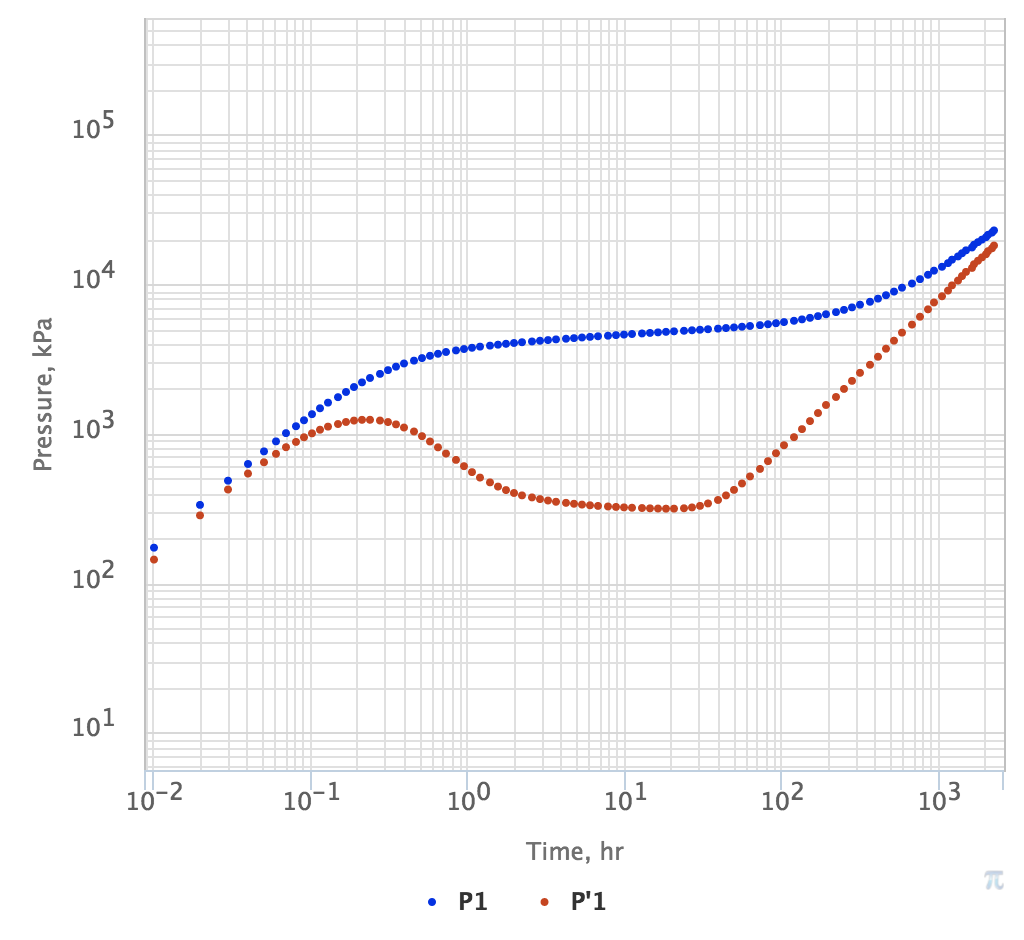
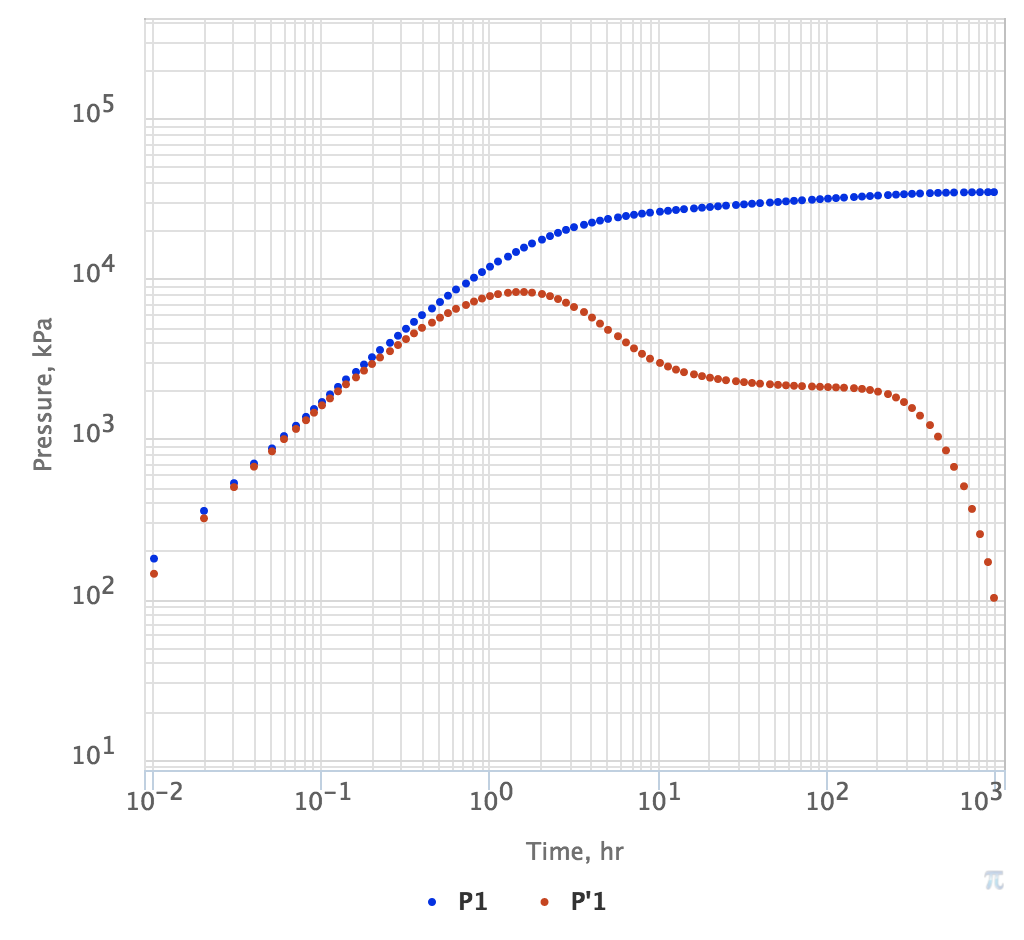
| Fig. 1. PTA Diagnostic Plot with IARF regime developing after 100 hrs | Fig. 2. PTA Diagnostic Plot with IARF regime developing after 100 hrs until PSS at 1,000 hrs | Fig. 3. PTA Diagnostic Plot with IARF regime developing after 100 hrs until SS at 1,000 hrs |
See Also
...
Petroleum Industry / Upstream / Subsurface E&P Disciplines / Field Study & Modelling / Reservoir Flow Simulation
...