...
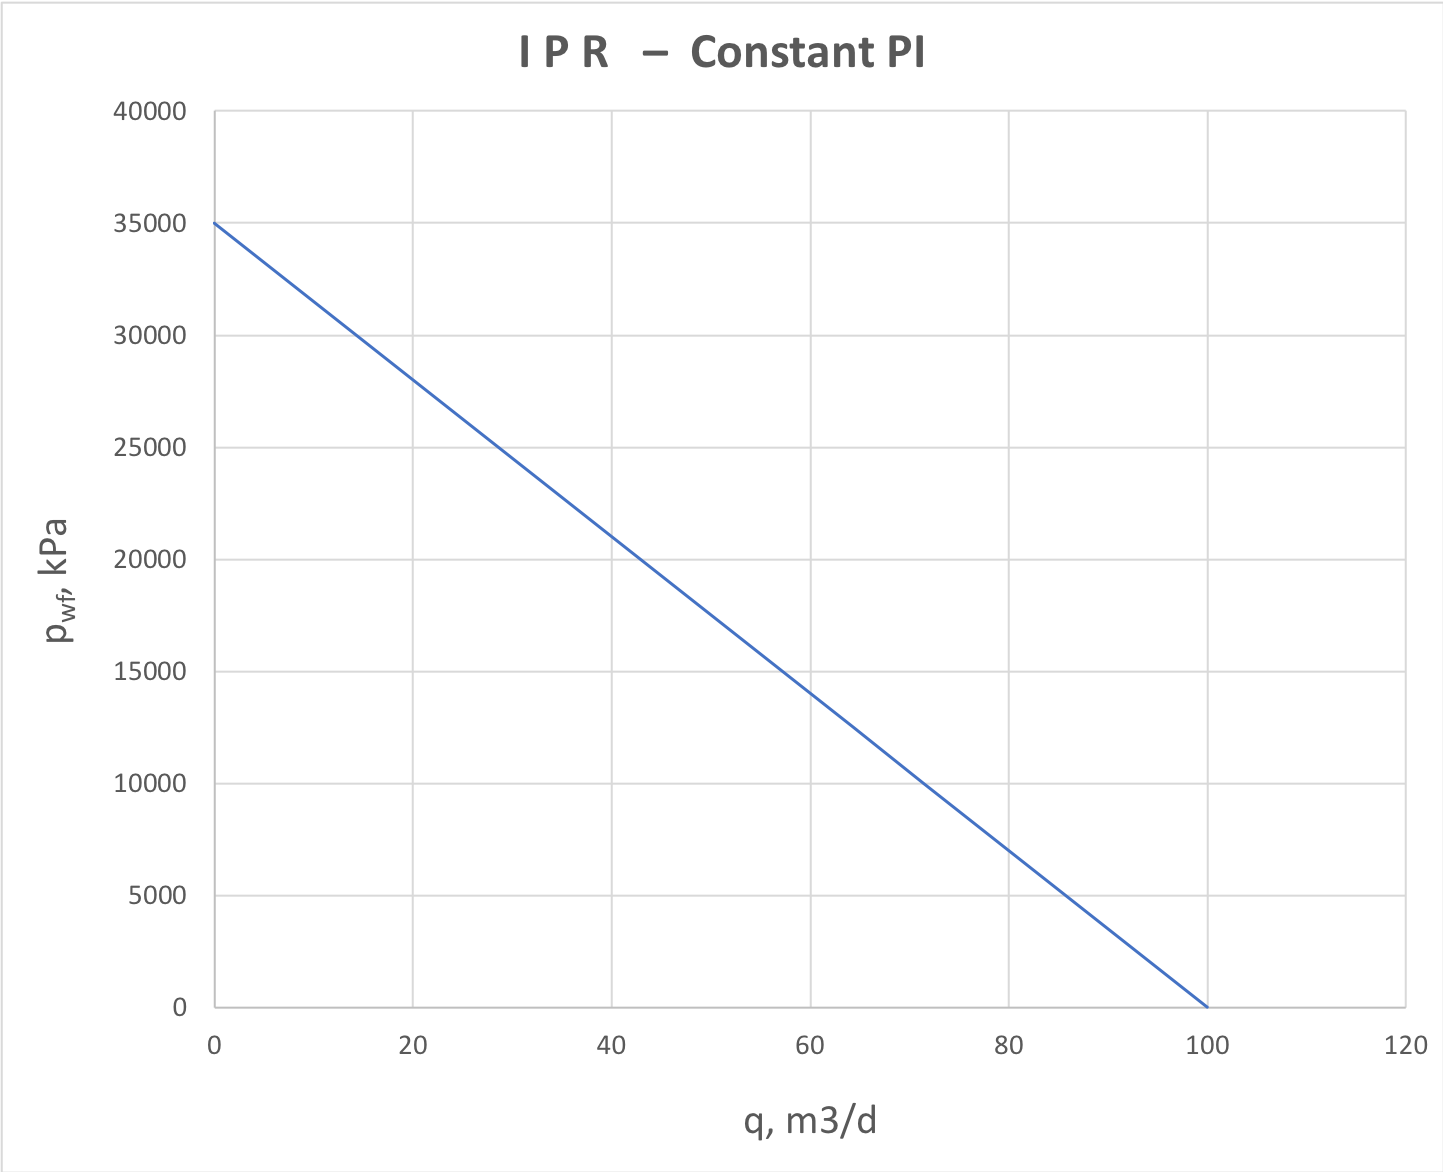
For a single layer formation with low-compressibility fluid (water or dead oil) the PI does not depend on drawdown (or flowrate)
| LaTeX Math Inline | ||
|---|---|---|
|
|
| Fig.1. WFP – Well Flow Performance plot for constant productivity (water and dead oil) |
...
For gas producers, the fluid compressibility is high and formation flow is essentially non-linear, inflicting the downward trend on the whole WFP – Well Flow Performance plot (Fig. 2).
|
Fig. 2. WFP – Well Flow Performance for dry gas producer or gas injector into a gas formation |

...
It can be interpreted as deterioration of near-reservoir zone permeability when the fluid velocity is high and modelled as rate-dependant skin-factor.
|
Fig. 3. WFP – Well Flow Performance for 2-phase oil+gas production below and above bubble point |

But when field-average formation pressure is above bubble-point
(which means that most parts of the drainage area are saturated oil) the PI can be farily approximated by some analytical correlations.LaTeX Math Inline body p_R > p_b
Multiphase IPR
...
For 3-phase water-oil-gas flow the IPR analysis is perfomed on oil and watr components (see Fig. 4.1 and Fig. 4.2).
|
|
Fig. 4.1. Oil WFP – Well Flow Performance for 3-phase (water + oil + gas) formation flow | Fig. 4.2. Water WFP – Well Flow Performance for 3-phase (water + oil + gas) formation flow |
...