WFP – Well Performance Analysis is a specialized analysis of correlation between surface flowrate and wellbore pressure as function of formation pressure and associated production optimization procedures.
- Assess current production performance
- current distribution of recovery against expectations
- current status and trends of recovery against expectations
- current status and trends of reservoir depletion against expectations
- current status and trends of water flood efficiency against expectations
- compare performance of different wells or different groups of wells
- Identify and prioritize surveillance opportunities
- Identify and prioritize redevelopment opportunities
This type of analysis is performed on stabilised flow and does not cover transient behavior which is normally covered in Well Tests domain.
The flow is called stabilised if the well productivity index is not changing over time.
It's important to remember the difference between constant rate flow and stabilised flow.
The stabilised flow may go through a gradually changing flow rate due to formation pressure change, while the productivity index stays constant.
On the other hand, the constant rate flow may not represent a stabilised flow as the bottom-hole pressure and productivity index maybe still in transition after the last rate change.
The WFP methods are not applicable if the well flow is not stabilised even if the flow rate is maintained constant.
There are two special reservoir flow regimes which are both stabilised and maintain constant flow rate: steady state regime (SS) and pseudo-steady state regime (PSS).
The steady state regime (SS) regime is reached when the flow is stabilised with the full pressure support at the external boundary.
The pseudo-steady state (PSS) regime is reached when the flow is stabilised with no pressure support at the external boundary.
In both above cases, the drawdown and flow rate will stay constant upon productivity stabilisation.
As for formation and bottom-hole pressure in PSS they will be synchronously varying while in SS they will be staying constant.
The table below is summarizing the major differences between SS and PSS regimes.
|
| Steady state regime (SS) | Pseudo-steady state (PSS) |
|---|
| Boundary |
| Full pressure support | No pressure support |
| Productivity index | | LaTeX Math Inline |
|---|
| body | J(t) = \frac{q}{\Delta p} |
|---|
|
| | |
| Flow rate | | | |
| | LaTeX Math Inline |
|---|
| body | \Delta p(t) = p_e(t) - p_{wf}(t) |
|---|
|
| | |
| Botom-hole pressure | | | |
| Formation pressure | | | |
It's again important to avoid confusion between the termines stationary conditions (which mean that refered properties are not chaning in time) and stabilised flow conditions which may admit pressure and rate vraition.
In practice, the productivity index is usually not known at all times as there is not routine procedure to assess it.
It is usually accepted that a given formation takes the same time to stabilise the flow after any change in well flow conditions and the stabilisation time is assessed based on the well tests analysis.
Although, this is not strictly true and the flow stabilisation time depends on well-formation contact and reservoir property variation around a given well.
This is also compromised in multi-layer formations with cross-layer communication.
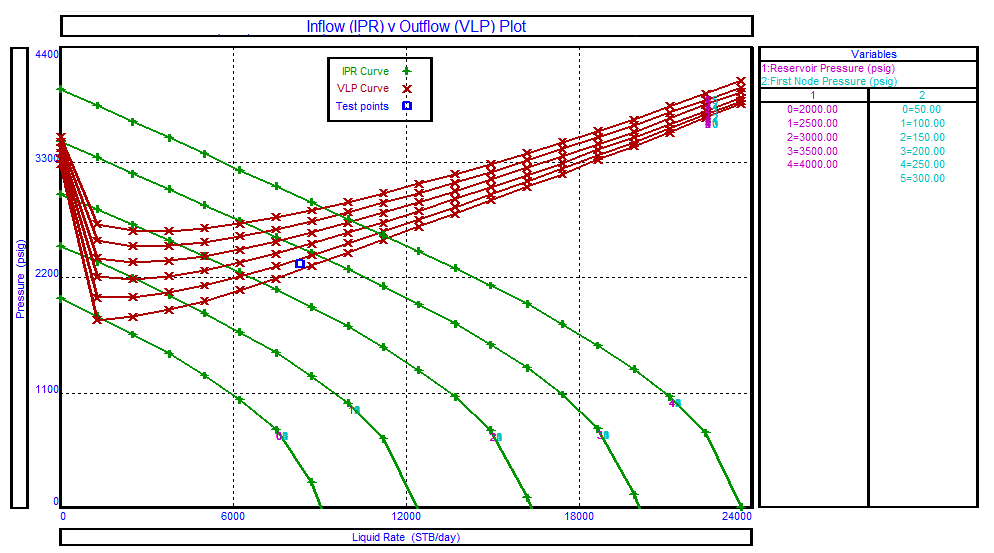
The conventional WFP – Well Performance Analysis is perfomed as the cross-lot with two physical models:
and
IPR – Inflow Performance Relation represnts the relation between the bottom-hole pressure
and surface flow rate
during the
stabilised flow:
| LaTeX Math Block |
|---|
|
p_{wf} = p_{wf}(q) |
которая в общем случае является нелинейной.
На практике удобно вести в рассмотрение понятие продуктивности скважины
, которая определяется следующим образом:
| LaTeX Math Block |
|---|
| J_s(q_{\rm liq}) = \frac{q_{\rm liq}}{p_R-p_{wf}} |
|
для нефтяной добывающей скважины, где добыча нефти и воды на поверхности |
| LaTeX Math Block |
|---|
| J_s(q_g) = \frac{q_g}{p_R-p_{wf}} |
|
для газовой добывающей скважины |
| LaTeX Math Block |
|---|
| J_s(q_g) = \frac{q_g}{p_{wf}-p_R} |
|
для газовой нагнетательной скважины |
| LaTeX Math Block |
|---|
| J_s(q_w) = \frac{q_w}{p_R-p_{wf}} |
|
для водяной нагнетательной скважины |
где
| дебиты (или расходы) воды, нефти, газа на устьевом сеператоре |
| средневзешанное пластовое давление по области дренирования пласта, вскрытого скважинной |
Опираясь на эти определения ИКС может быть записана в универсальном вид для всех типов скважин:
| LaTeX Math Block |
|---|
|
p_{wf} = p_R - \frac{q}{J_s(q)} |
При этом в кажом конкретном случае выбирается правильный знак второго слагаемого и правильный смысл дебита
:
| для добывающих скважин |
| для нагнетательных скважин |
| LaTeX Math Inline |
|---|
| body | q=q_{\rm liq}=q_o+q_w |
|---|
|
| для добывающей нефтяной скважины |
| для газовых скважин (добывающих и нагнетельных) |
| для водяных скважин (добывающих и нагнетательных) |
ИКС активно используется для анализа оптимального режима работы скважины.
Для однопластовой залежи со слабосжимаемым флюидом продуктивность не зависит от дебита
и график ИКС представляет собой прямую линию (Рис. 1).
|
| Fig.1. IPR for low-compressible fluid production (water, undersaturated oil) |
Это характерно для водозаборных скважин, водонагнетательных скважин и нефтяных скважин выше давления насыщения.
Для газовых скважин, газоконденсатных скважин, скважин с легкой нефтью, а также нефтяных скважин, где давление опустилось ниже давления насыщения
, сжимаемость фильрующегося агента являестя высокой, закон фильтрации в прибойной зоне скважины становится нелинейным и кривая ИКС начинает отклоняется вниз от прямой линии (Рис. 2), что означает
ухудшение продуктивности скважины с ростом скорости фильтрации в призабойной зоне.
|
Fig.2. IPR for compressible fluid production (gas, light oil, saturated oil) |
КВЛ активно используется для анализа оптимального режима работы скважины.
|
| Fig 3. VLP for low-compressible fluid |
|
| Fig 4. VLP for compressible fluid |
|
| Fig. 5. WFP for stairated oil |
|
| Fig. 6. WFP for stairated oil |