...
|
|
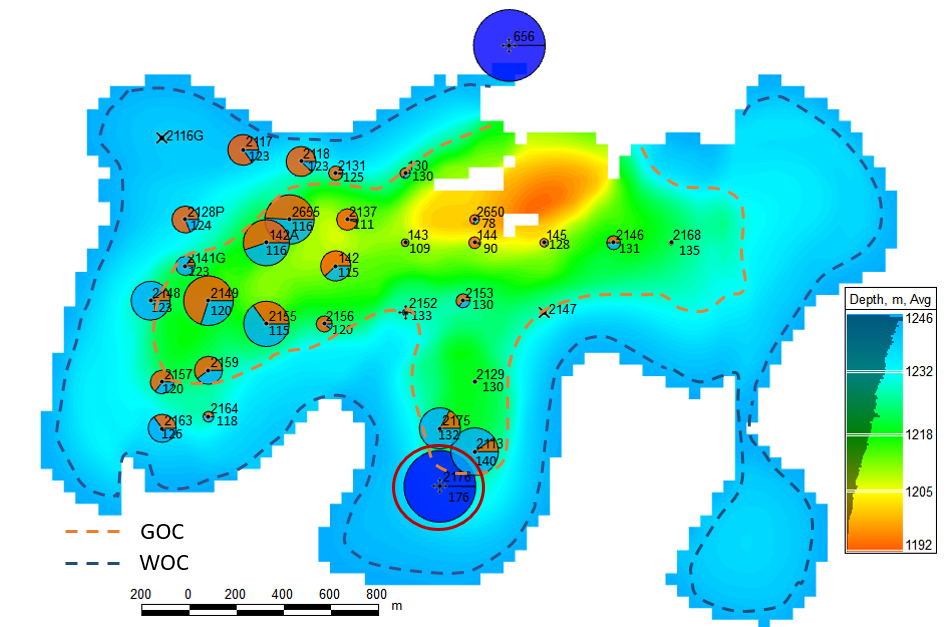
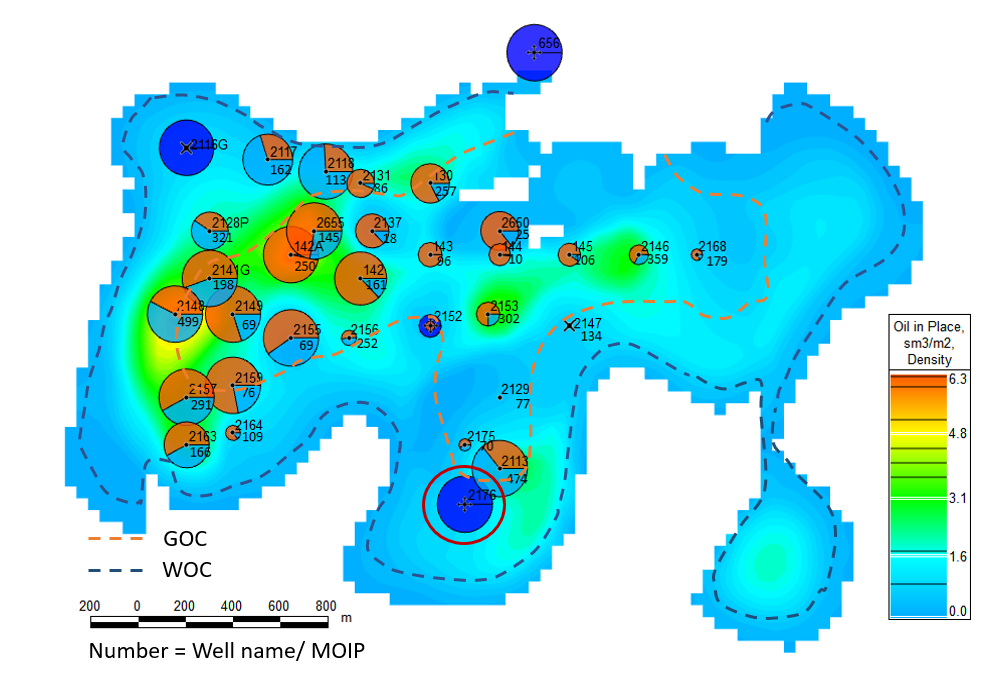
| Fig. 1.1. Production History Map | Fig. 1.2. Recovery Map |
|
|
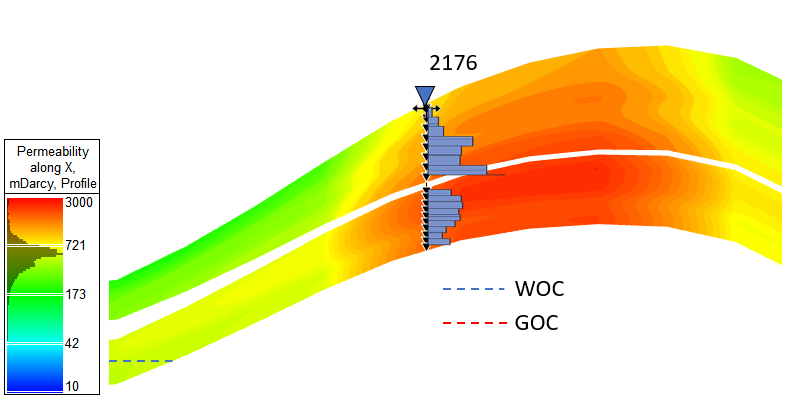
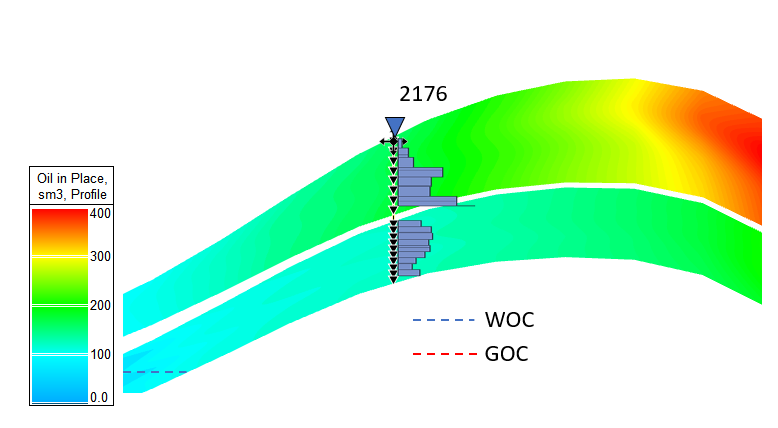
| Fig. 2.1. Cross-section & PLT | Fig. 2.2. Cross-section & PLT |
|
|
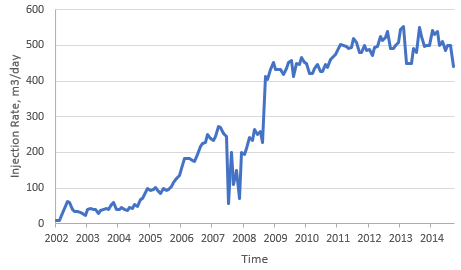
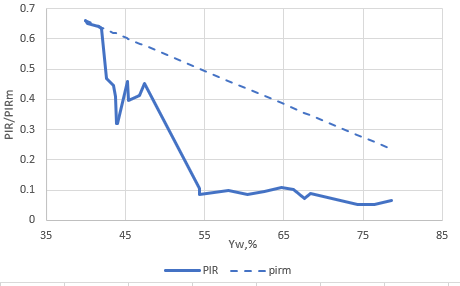
| Fig. 3.1. Injection History Graphs | Fig. 3.2. Injection Efficiency Diagnostics |
|
|
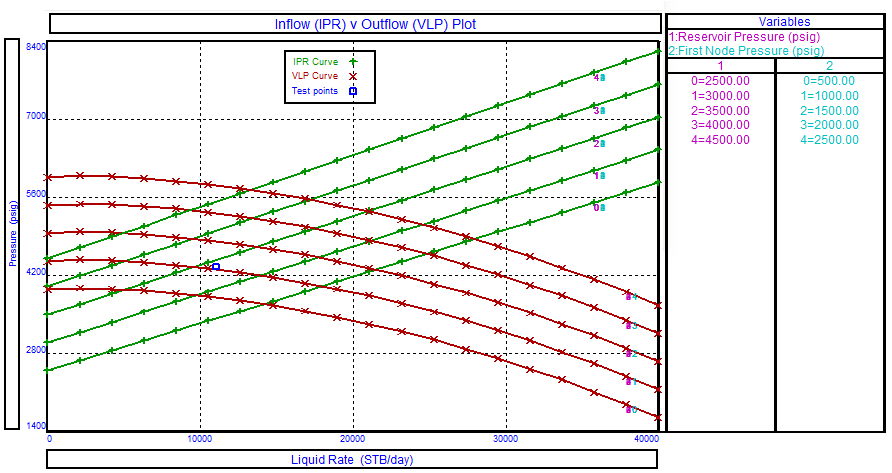
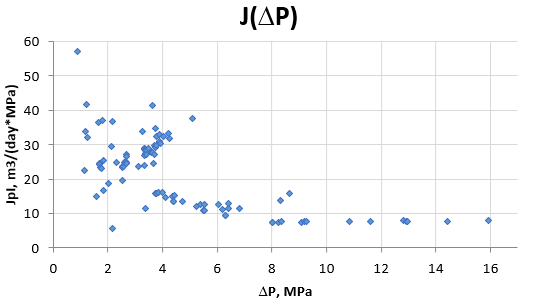
| Fig. 4. Well Performance Analysis (VFP + IPR) | Fig. 5. Injectivity Index Diagnostic |
| |
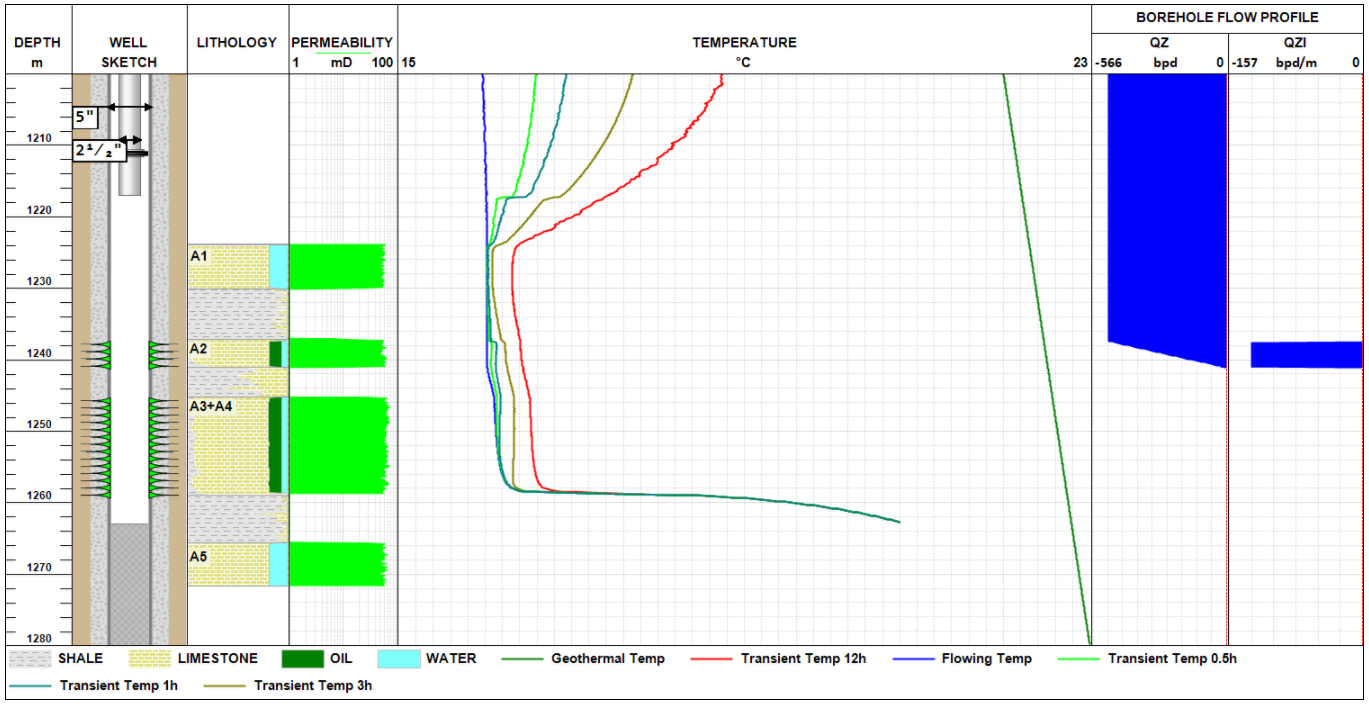
| Fig. 6. Well Completion & PLT |
...