...
|
|
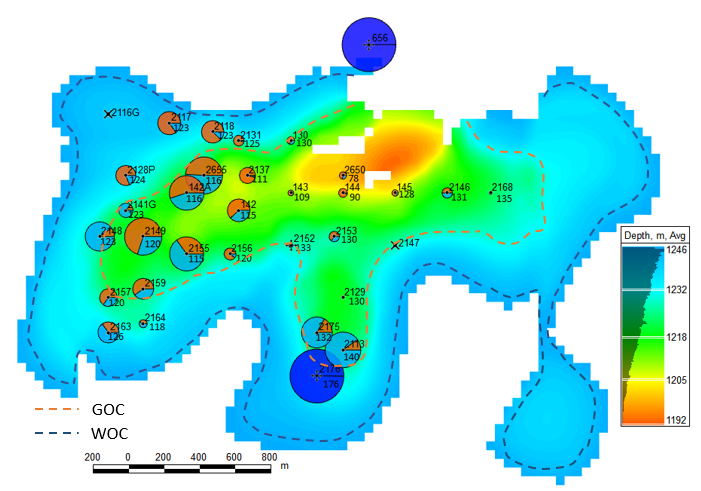
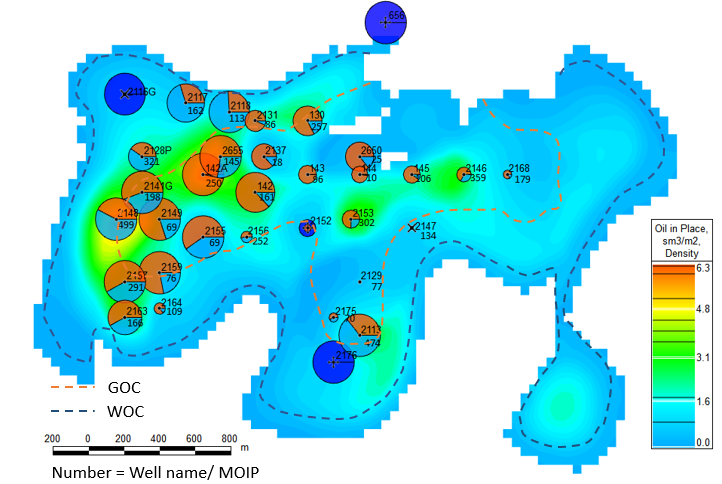
Fig. 1.1. Production History Map | Fig. 1.2. Recovery Map |
|
|
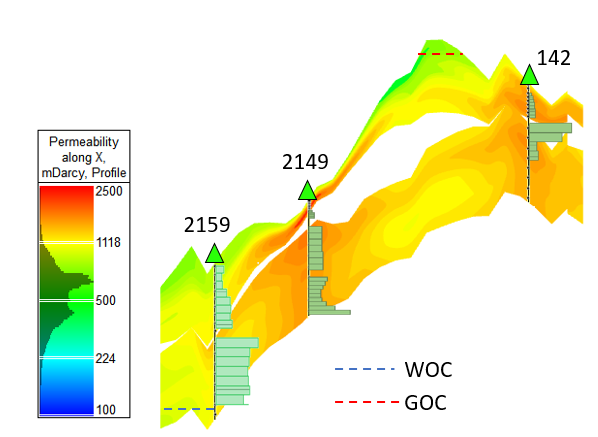
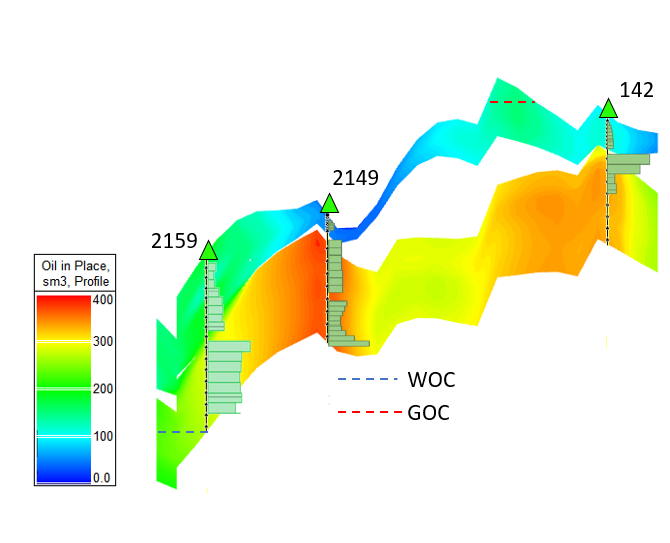
| Fig. 2.1. Cross-section & PLT, permeability, GOC, OWC | Fig. 2.2. Cross-section & PLT, STOIIP, GOC, OWC |
|
|
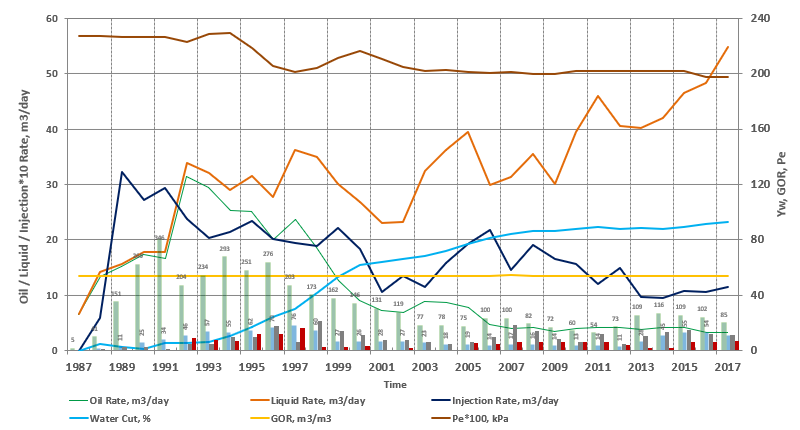
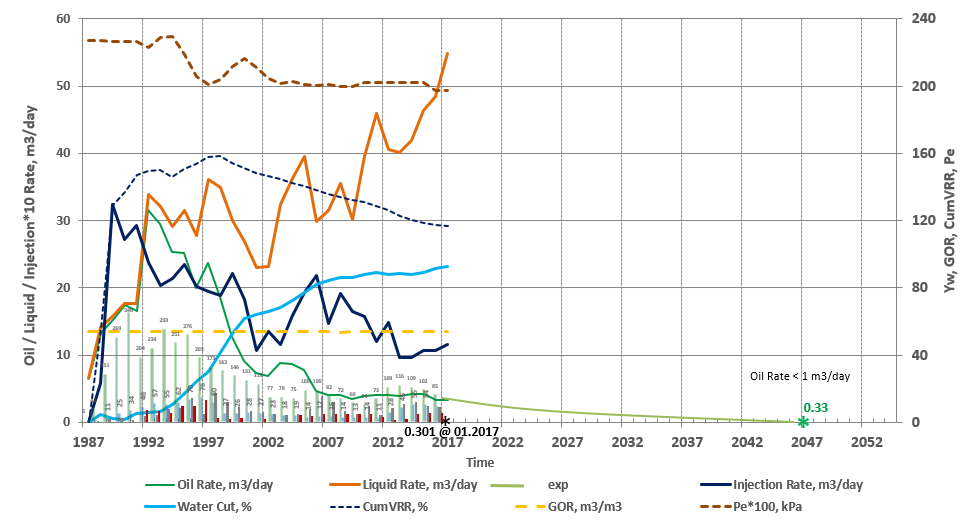
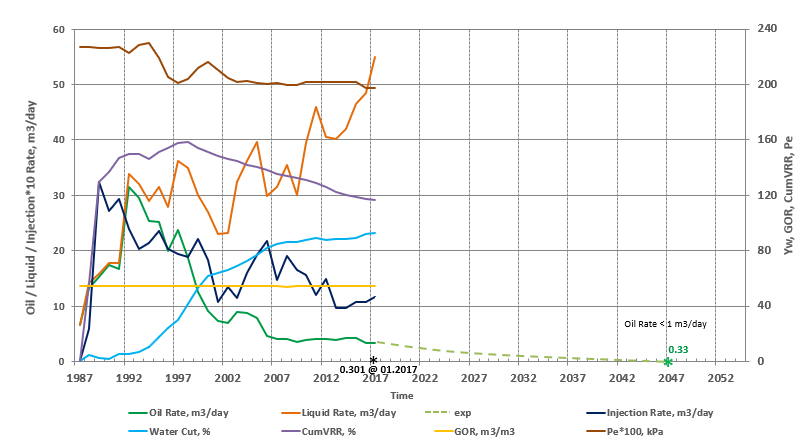
| Fig. 3.1. Production History Graphs | Fig. 3.2. Production Forecasts |
|
|
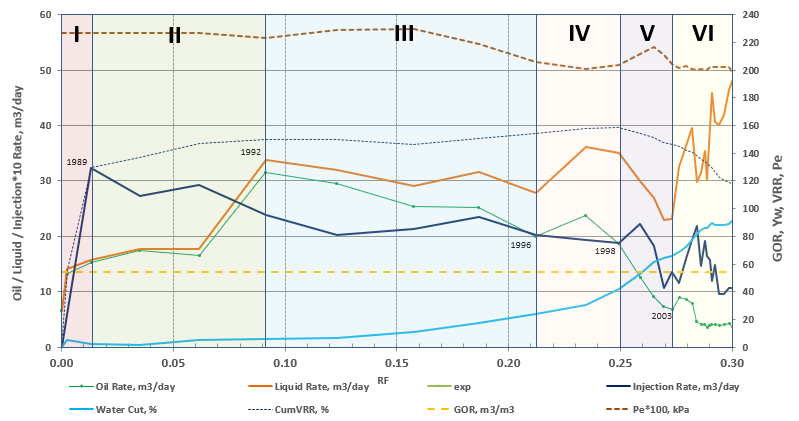
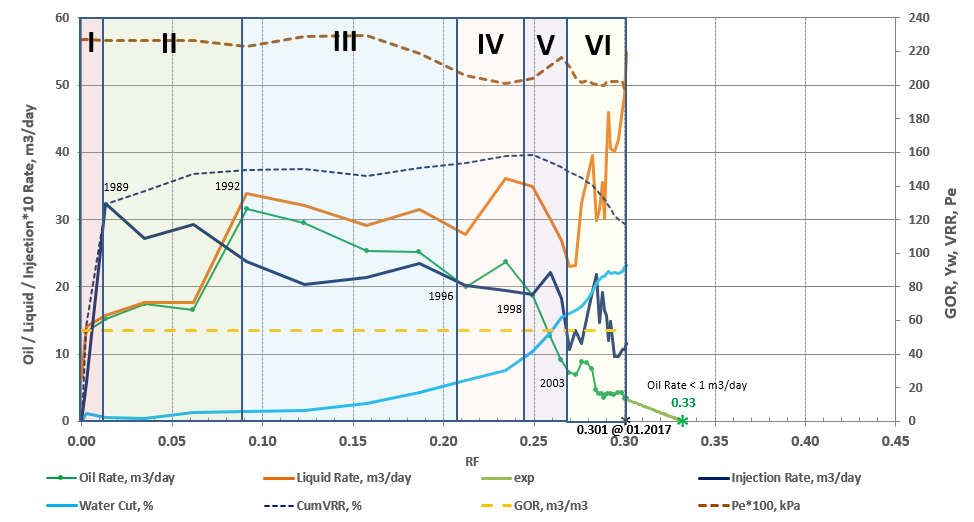
| Fig. 4.1. Recovery History | Fig. 4.2. Recovery Forecasts |
| 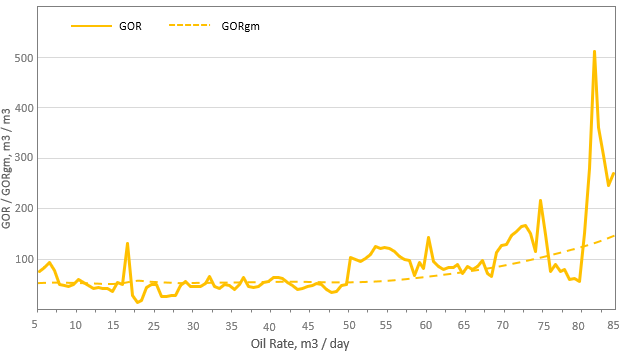 |
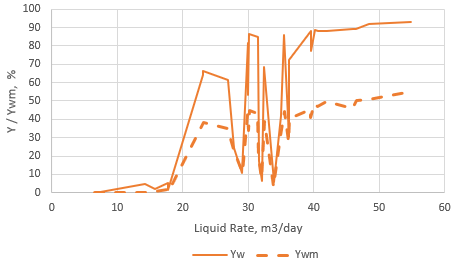
| Fig. 5.1. WOR Diagnostic | Fig. 5.2. GOR Diagnostic |
|
|
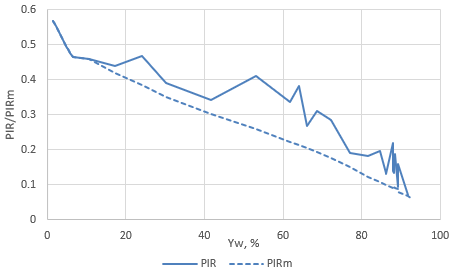
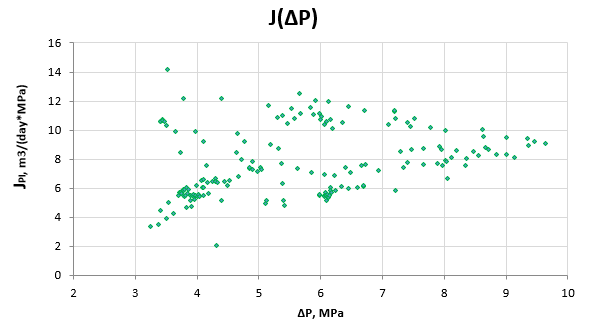
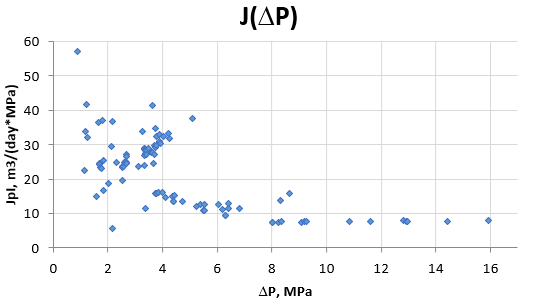
| Fig. 6.1. Productivity Index Diagnostic | Fig. 6.2. Injectivity Index Diagnostic |
 | |
| Fig. 7. Injection Efficiency Diagnostics |
...