A partial case of Phase Equilibrium with two fluid phases staying at Thermodynamic equilibrium.
In other words it's a state of thermodynamic equilibrium between the 2-phase region on PT Diagram where both liquid and gas state of a Fluid Mixture. The PT Diagram for Pure Substance will see Vapour Liquid Equilibrium (VLE) as a set of points along a smooth curve ending up with a Critical Point
| LaTeX Math Inline | ||
|---|---|---|
|
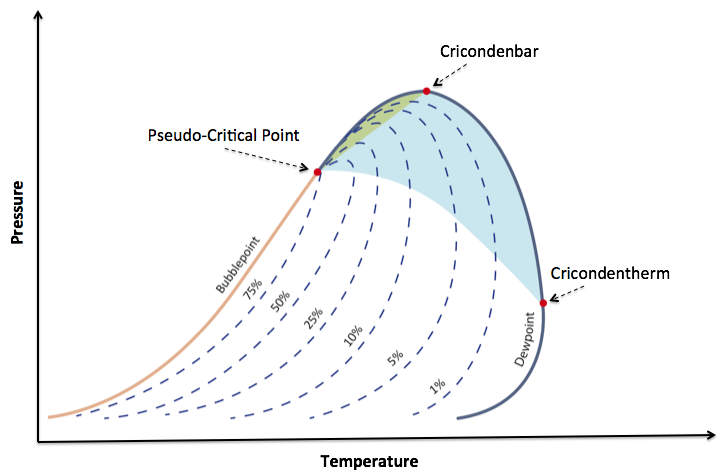
The PT Diagram for Fluid Mixture will see Vapour Liquid Equilibrium (VLE) as a closed area Vapour Liquid Envelope is bounded by Bubble Point Curve and Dew Point Curve with a junction at at Pseudo-Critical Point Point
(see Fig. 2).LaTeX Math Inline body --uriencoded--(T_%7Bpc%7D, p_%7Bpc%7D)
|
| Fig. 1. Schematic PT Diagram with Vapour Liquid Equilibrium area and Pseudo-Critical PointEnvelope. |

See also
...
Natural Science / Physics / Thermodynamics / Thermodynamic system / Thermodynamic equilibrium / Phase Equilibrium / Phase Equilibrium Diagram / Vapour Liquid Equilibrium (VLE)
[ State of matter ][ Pure substance ] [ Mixtures ][ Fluid Mixtures ][ Phase ][ Liquid Quality ]][ Vapour Quality ]
[ Dew Point Curve ][ Bubble Point Curve ]
[ Critical Point (Tc, Pc) ][ Сritical Temperature Tc ] [ Critical Pressure (pc) ][ Cricondentherm ][ Cricondenbar ]
| Show If | ||
|---|---|---|
| ||