changes.mady.by.user Arthur Aslanyan (Nafta College)
Saved on Jan 13, 2020
...
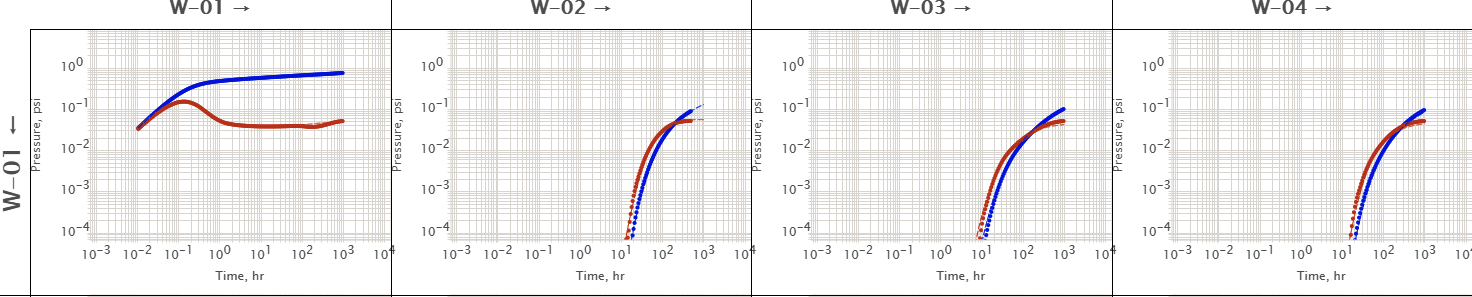
Fig. 3. UTR output diagram from RDCV. The column wells are showing pressure response to row wellswell W-01.
The first cell is showing self-response DTR and the other cells showing cross-well response CTRs.