changes.mady.by.user Arthur Aslanyan (Nafta College)
Saved on Jan 13, 2020
...
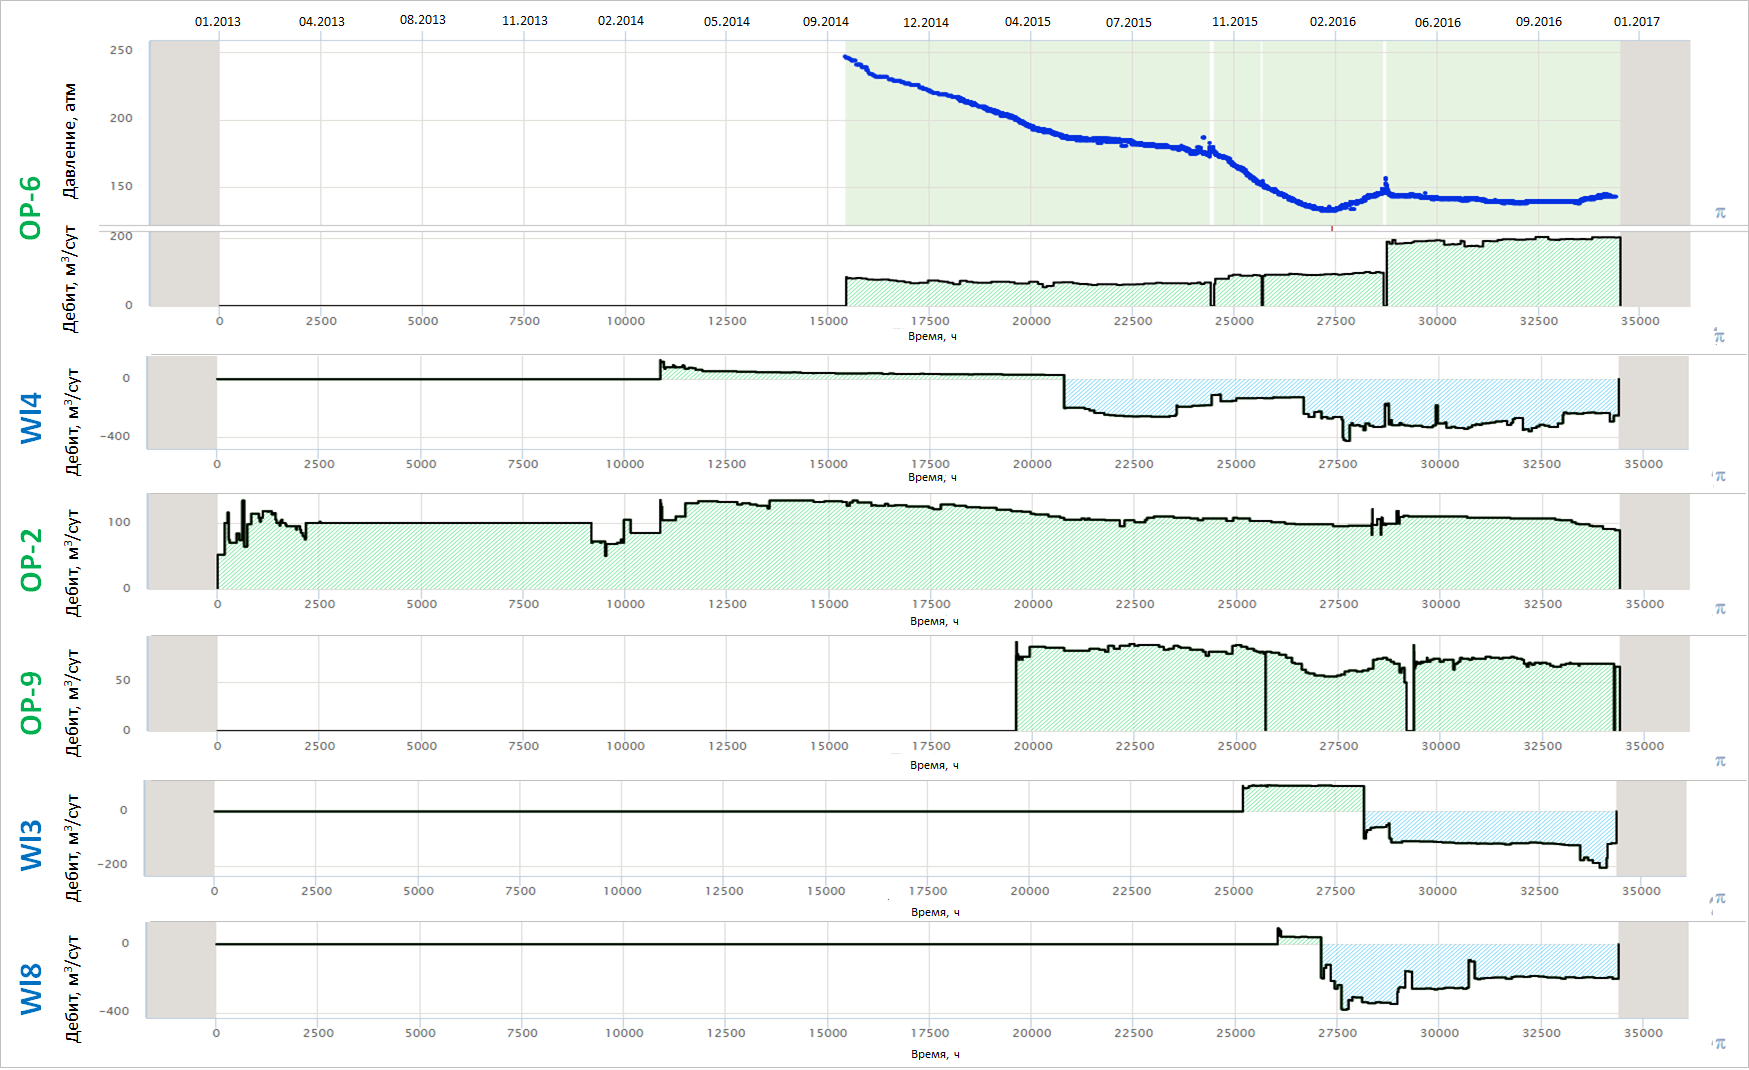
Fig. 2. Production History
Image RemovedImage Added
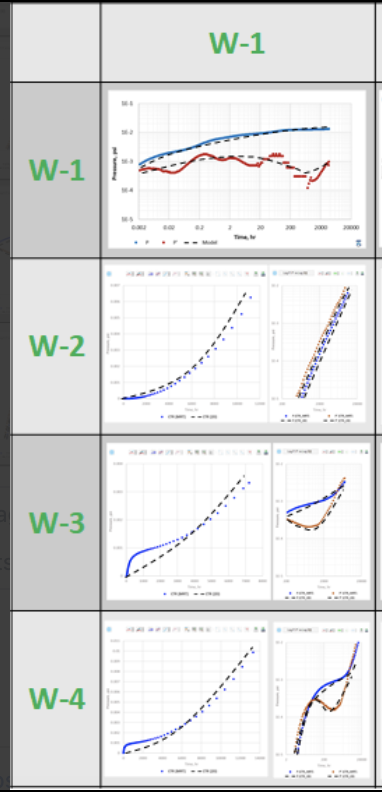
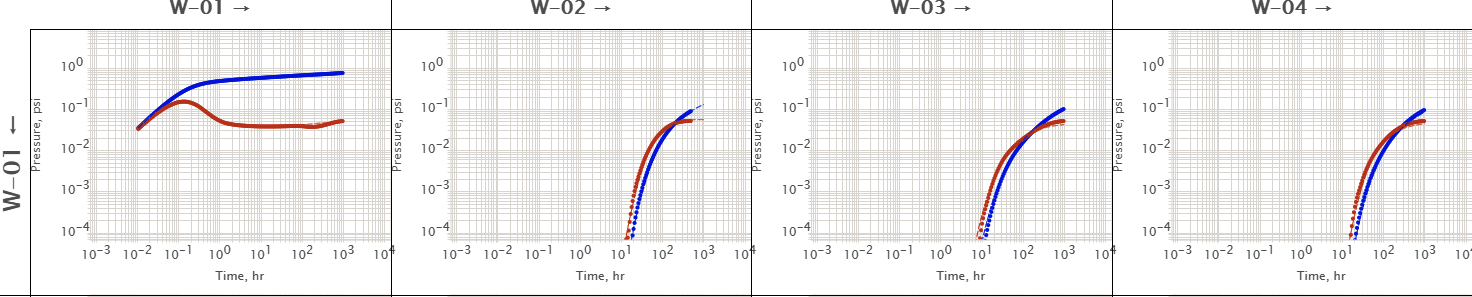
Fig. 3. UTR output diagram from RDCV. The column well is wells are showing pressure response to row wells.
The first cell is showing self-response DTR and the other cells showing cross-well response CTRs.