...
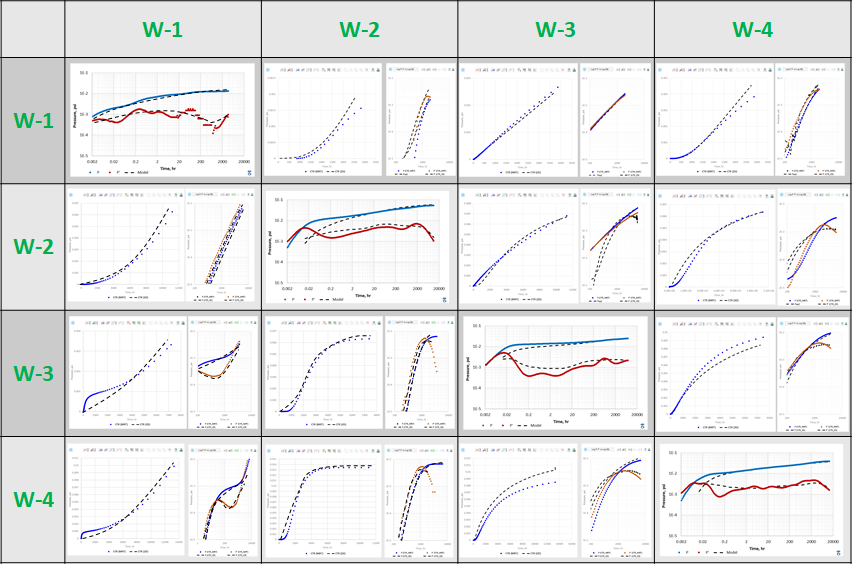
A table matrix with elements showing various UTRs for a given group of wells with diagonal elements showing self-response DTRs and non-diagonal elements showing cross-well response CTRs.
It is a comfortable tool to analyse cross-well interference and understand the discrepancies with existing reservoir flow model.
The
|
| Fig. 1. Example of PIM The column wells showing pressure response to row wells. Diagonal elements are showing self-response DTRs. Non-diagonal elements showing cross-well response CTRs. |
...