...
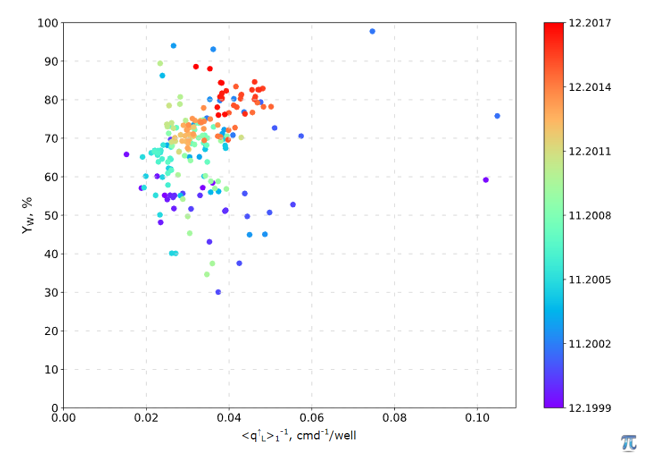
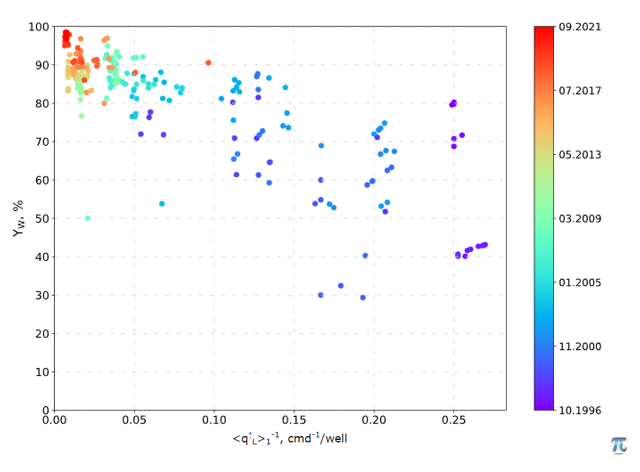
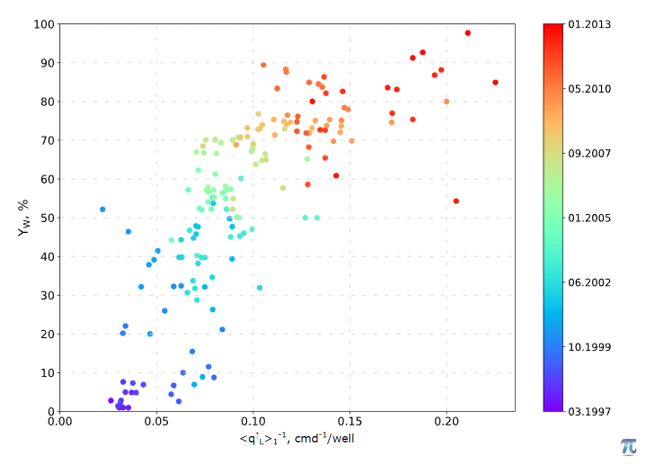
One if the Watercut Diagnostics plots with water cut (Yw) along y-axis and inverse liquid rate
| LaTeX Math Inline | ||
|---|---|---|
|
|
|
|
| Fig. 1 – Good Water | Fig. 2 – Bad Water with low pressure | Fig. 3 – Bad Water with high pressure |


...
...
One if the Watercut Diagnostics plots with water cut (Yw) along y-axis and inverse liquid rate
| LaTeX Math Inline | ||
|---|---|---|
|
|
|
|
| Fig. 1 – Good Water | Fig. 2 – Bad Water with low pressure | Fig. 3 – Bad Water with high pressure |
...