| RTA NPI Diagnostic Plot |
|---|
|
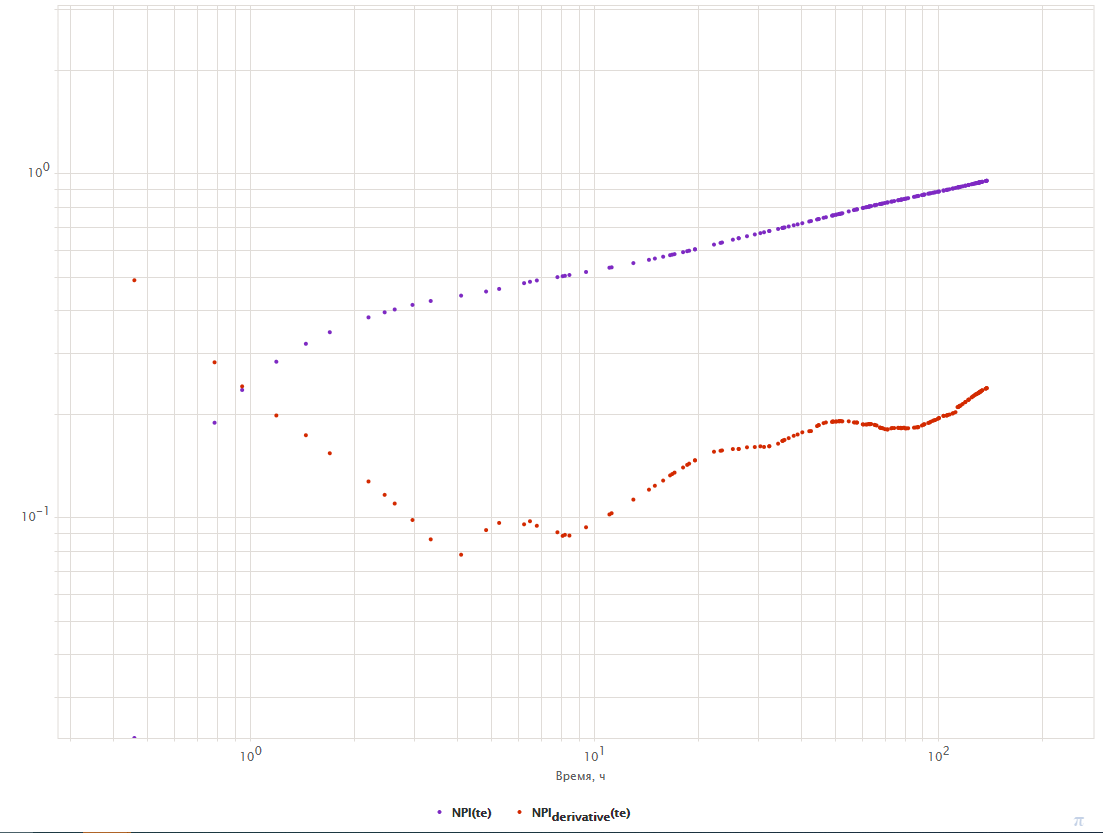
| Fig. 1. RTA NPI Diagnostic Plot Sample. Normalized Pressure Integral (in blue) and its log-derivative (in red). |
See Also
Petroleum Industry / Upstream / Production / Subsurface Production / Field Study & Modelling / Production Analysis / Rate Transient Analysis (RTA)
[ Pressure Transient Analysis (PTA) ]