Interpretation workflow of pressure transitions in pressure test data in terms of well properties and formation properties of connected subsurface reservoirs.
It may refer to analysis of a stand-alone pressure transient or several pressure transients (MRST) and may also cover transitions in off-set wells (PIT).
Both downhole (BHP) and surface (THP) pressure records can be a source data to PTA.
The quantitative interpretation of pressure transitions is based on pressure diffusion model.
Formation pressure {p_i}, skin-factor S, transmissibility \sigma and pressure diffusivity \chi are called basic diffusion model parameters as they are essential components of all diffusion models.
Below are the major types of PTA with abbreviation and indication of well flow status during the test:
Objectives
| Primary deliverables | Math Symbol | Conditional Deliverables | Math Symbol |
|---|---|---|---|
Current Formation pressure | p_e | Initial formation pressure assuming no or little historical interference with offset wells | p_i |
S | Formation damage as permeability deterioration assuming damage penetration is known Formation damage penetration assuming damage value is known Fracture-network development around the well | ||
\sigma | Permeability assuming flowing thickness h is known Flowing thickness assuming permeability k is known Water-oil column assuming permeability k and flowing thickness h are both known | k h h_{OWC} | |
Minimum drainable volume around the well | V_\phi | Minimum hydrocarbon reserves around the well Drainage area around the well assuming flowing thickness h is known Flowing thickness assuming the drainage area A around the well is known Boundary proximity assuming the circular boundary | V_{hc} A_e h r_e |
| Minimum drainable area around the well | A_e | Half-size of drainage area r_e providing the shape of the drainable area is known | |
Boundary type | PSS, \, SS, \, BAFFLE | ||
| Effective horizontal section | L_f | ||
Hydraulic fracture size | X_f | ||
Dynamic fracture opening threshold | \delta P_{X_f} | ||
Proximity r_{ext} of the remote reservoir composition Transmissibility \sigma_{ext} of the remote reservoir composition | W_{ch}, \, D_{ch} R_{owf} R_{ogf} | Channel width and proximity to its nearest boundary Proximity to oil-water front Proximity to oil-gas front | |
| Scanning area around the well | A_{\rm scan} | Scanning radius of the area r_{\rm scan} around the well assuming radial isobaric propagation |
Interpretation
Samples
|
|
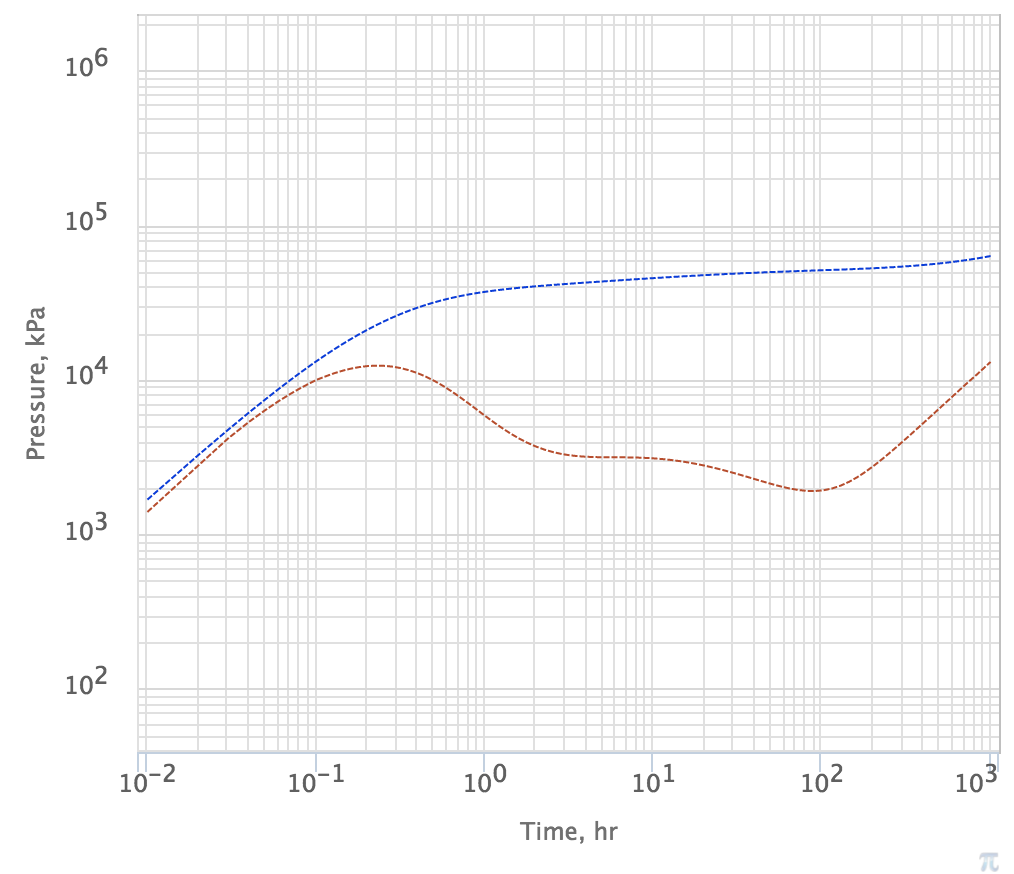
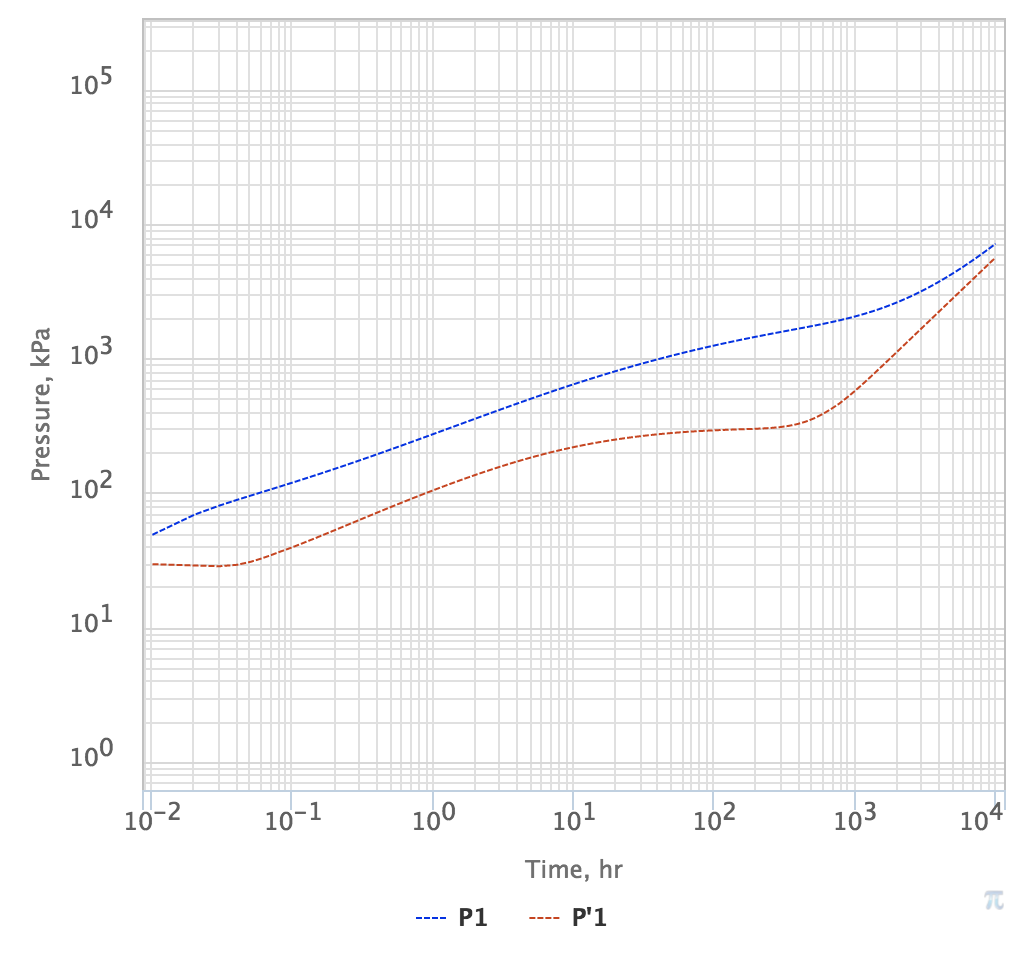
Fig. 1. Transient response in vertical well. Pressure drop is in blue and log-derivate of Pressure drop is in red | Fig. 2. Transient response in horizontal well Pressure drop is in blue and log-derivate of Pressure drop is in red |
See Also
Petroleum Industry / Upstream / Subsurface E&P Disciplines / Well Testing / Pressure Testing
[ Well & Reservoir Surveillance ] [ PTA Diagnostic Plot ]
[ Rate Transient Analysis (RTA) ]