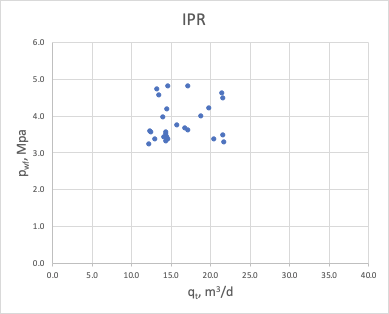
One of the Productivity Diagnostics methods based on relation between the bottom-hole pressure p_{wf} and surface flow rate q during the stabilised formation flow (see the reference to original paper of Gilbert):
| (1) | p_{wf} = p_{wf}(q) |
One of the two key concepts of Well Flow Performance analysis along with Vertical Lift Performance (VLP).
The word "Inflow" is misnomer as IPR analysis is applicable for both producers and injectors.
The most general proxy-model is given by LIT (Laminar Inertial Turbulent) IPR model:
| (2) | a \, q + b \, q^2 = \Psi(p_r) - \Psi(p_{wf}) |
where
p_r | static wellbore pressure |
a | laminar flow coefficient |
b | turbulent flow coefficient |
\Psi(p) | pseudo-pressure function specific to fluid type |
It needs well tests at least three different rates to assess \{ a \, , \, b, \, p_r \} but obviously more tests will make assessment more accurate.
The IPR analysis is closely related to well Productivity Index (PI) J_s which is defined as below:
| for oil producer with oil flowrate q_O at surface conditions | ||
| for gas producer with gas flowrate q_G at surface conditions | ||
| for gas injector with injection rate q_{GI} at surface conditions | ||
| for water injector with injection rate q_{WI} at surface conditions |
where
p_r | field-average formation pressure estimate within the drainage area V_e of a given well: p_r = \frac{1}{V_e} \, \int_{V_e} \, p(t, {\bf r}) \, dV |
Based on above defintions the aribitrary IPR can be wirtten in a general form:
| (7) | p_{wf} = p_r - \frac{q}{J_s} |
providing that q has a specific meaning and sign as per the table below:
- | for producer |
+ | for injector |
q=q_o | for oil producer |
q=q_g | for gas producer or injector |
q=q_w | for water injector or water producer or water production from oil producer |
See more on the variations of PI definition between Dynamic Modelling, Well Flow Performance and Well Testing.
The Productivity Index can be constant (showing a straight line on IPR like on Fig. 2) or dependent on bottomhole pressure p_{wf} or equivalently on flowrate q (showing a curved line on IPR like on Fig. 3) .
In general case of multiphase flow the PI J_s features a complex dependance on bottom-hole pressure p_{wf} (or equivalently on flowrate q) which can be etstablished based on numerical simulations of multiphase formation flow.
For undersaturated reservoir the numerically-simulated IPRs have been approximated by analytical models and some of them are brought below.
These correlations are usually expressed in terms of q = q (p_{wf}) as alternative to (7).
They are very helpful in practise to design a proper well flow optimization procedure.
These correaltions should be calibrated to the available well test data to set a up a customised IPR model for a given formation.
Water and Dead Oil IPR
For a single layer formation with low-compressibility fluid (water or dead oil) the PI does not depend on drawdown (or flowrate) J_s = \rm const and IPR plot is represented by a straight line (Fig. 2)
|
| Fig. 2. IPR plot for constant productivity (water and dead oil) |
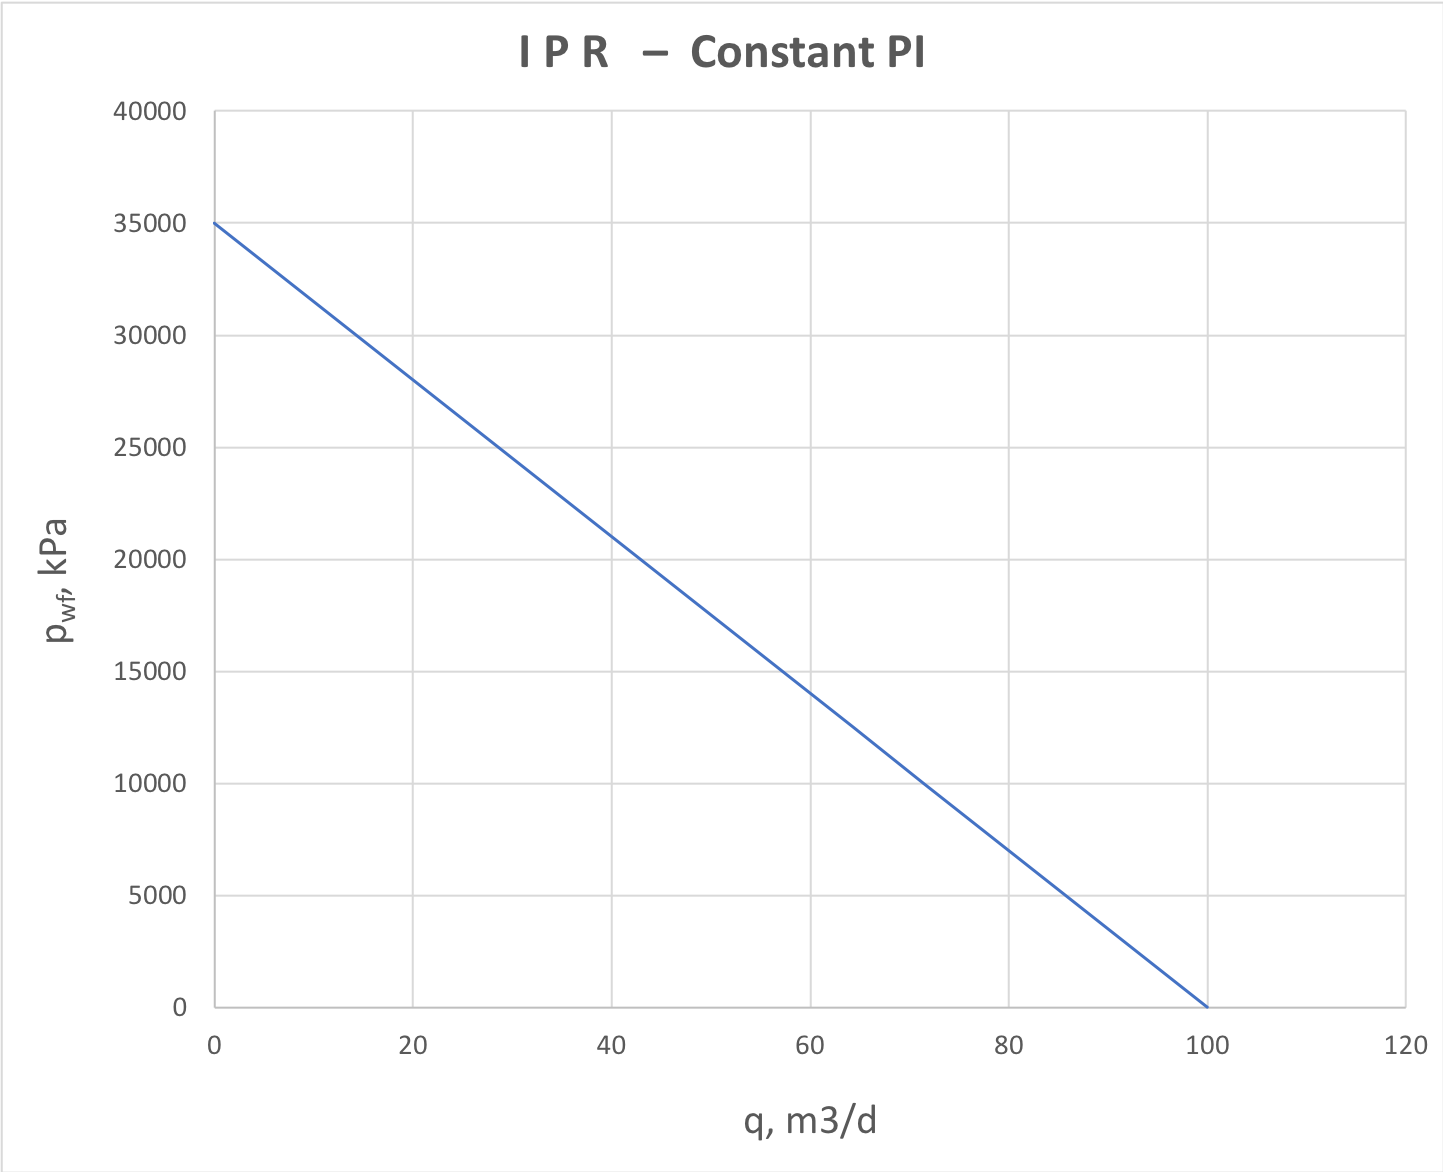
This is a typical IPR plot for water supply wells, water injectors and dead oil producers.
For the oil/water production the PI can be estimated using the Dupuit PI @model:
| (8) | J_s = \frac{2 \pi \sigma}{ \ln \frac{r_e}{r_w} + \epsilon+ S} |
where \sigma = \Big \langle \frac{k} {\mu} \Big \rangle \, h = k \, h\, \Big[ \frac{k_{rw}}{\mu_w} + \frac{k_{ro}}{\mu_o} \Big] – water-based or water-oil-based transmissibility above bubble point
,\epsilon = 0.5 for steady-state SS flow and \epsilon = 0.75 for pseudo-steady state PSS flow.
The alternative form of the constant Productivity Index IPR is given by:
| (9) | \frac{q}{q_{max}} = 1 -\frac{p_{wf}}{p_r} |
where q_{max} = J_s \, p_R is the maximum reservoir deliverability when the bottom-hole is at atmospheric pressure and also called Absolute Open Flow (AOF).
Dry Gas IPR
For gas producers, the fluid compressibility is high and formation flow is essentially non-linear, inflicting the downward trend on the whole IPR plot (Fig. 3).
|
Fig. 3. IPR for dry gas producer or gas injector into a gas formation |
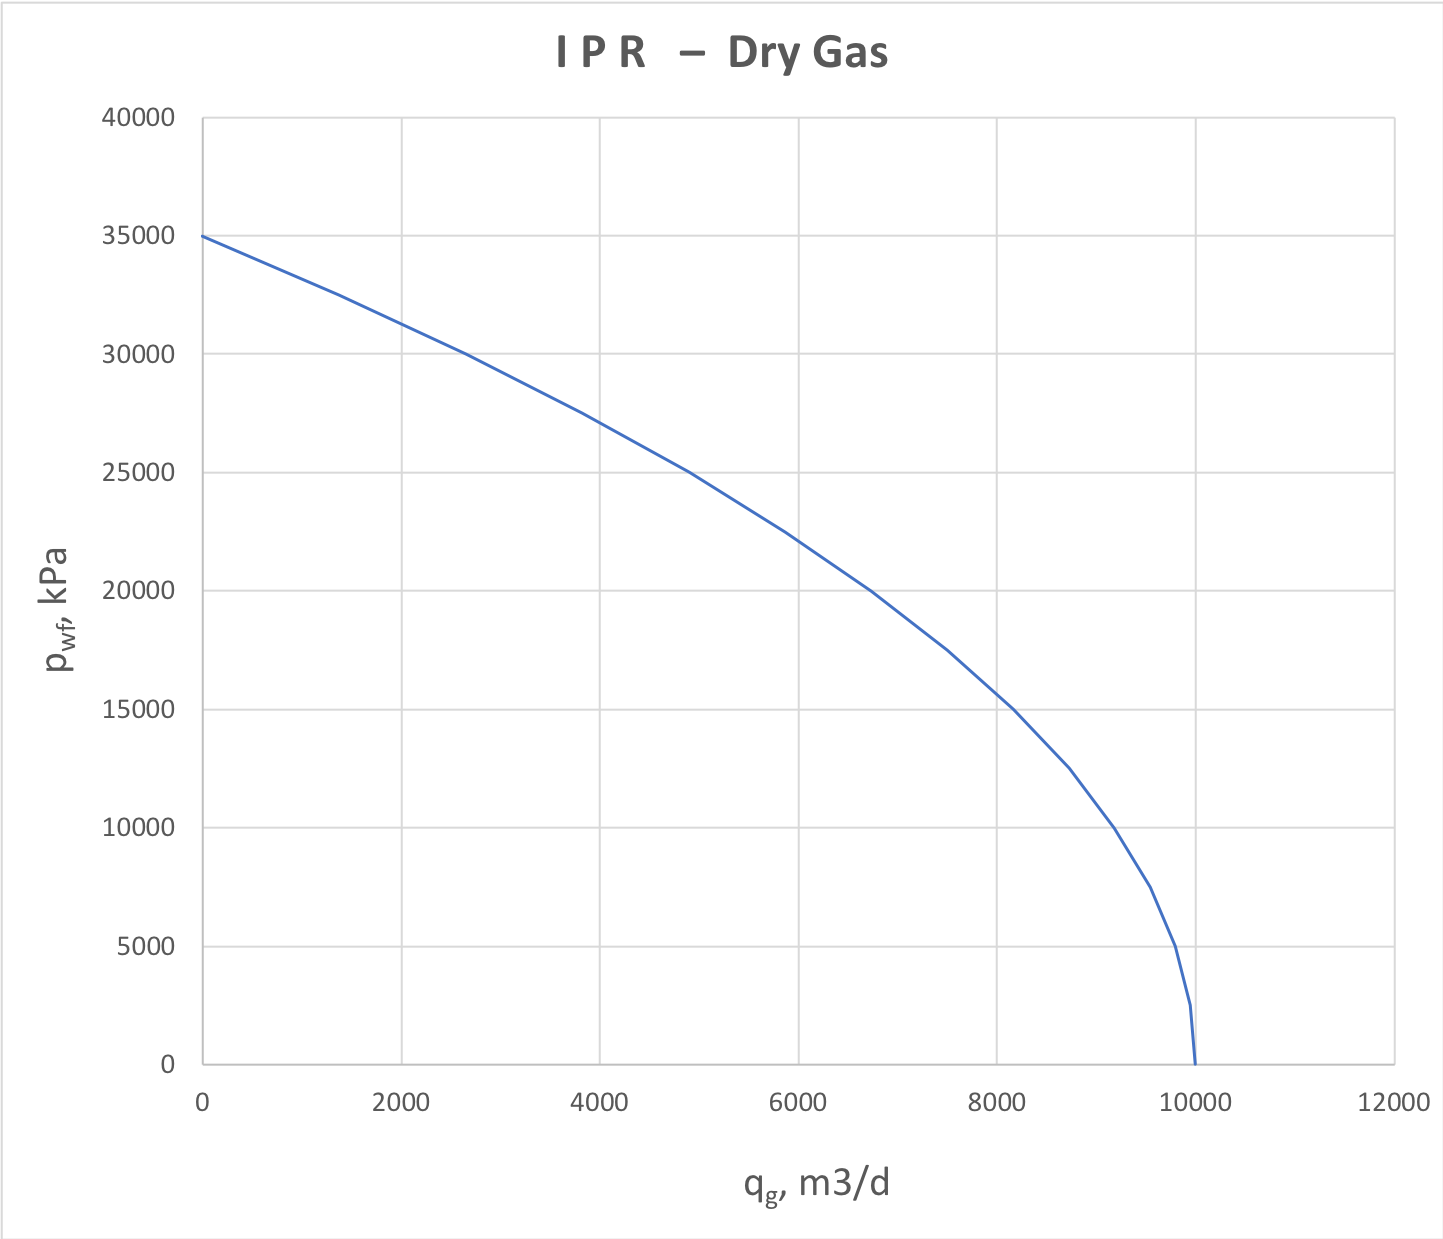
The popular dry gas IPR correlation is Rawlins and Shellhardt:
| (10) | \frac{q}{q_{max}} = \Bigg[ \, 1- \Bigg( \frac{p_{wf}}{p_r} \Bigg)^2 \, \Bigg]^n |
where n is the turbulent flow exponent, equal to 0.5 for fully turbulent flow and equal to 1 for laminar flow.
Saturated Oil IPR
For saturated oil reservoir the free gas flow inflict the downward trend of IPR plot similar to dry gas (Fig. 4).
|
Fig. 4. IPR for 2-phase oil+gas production below and above bubble point |
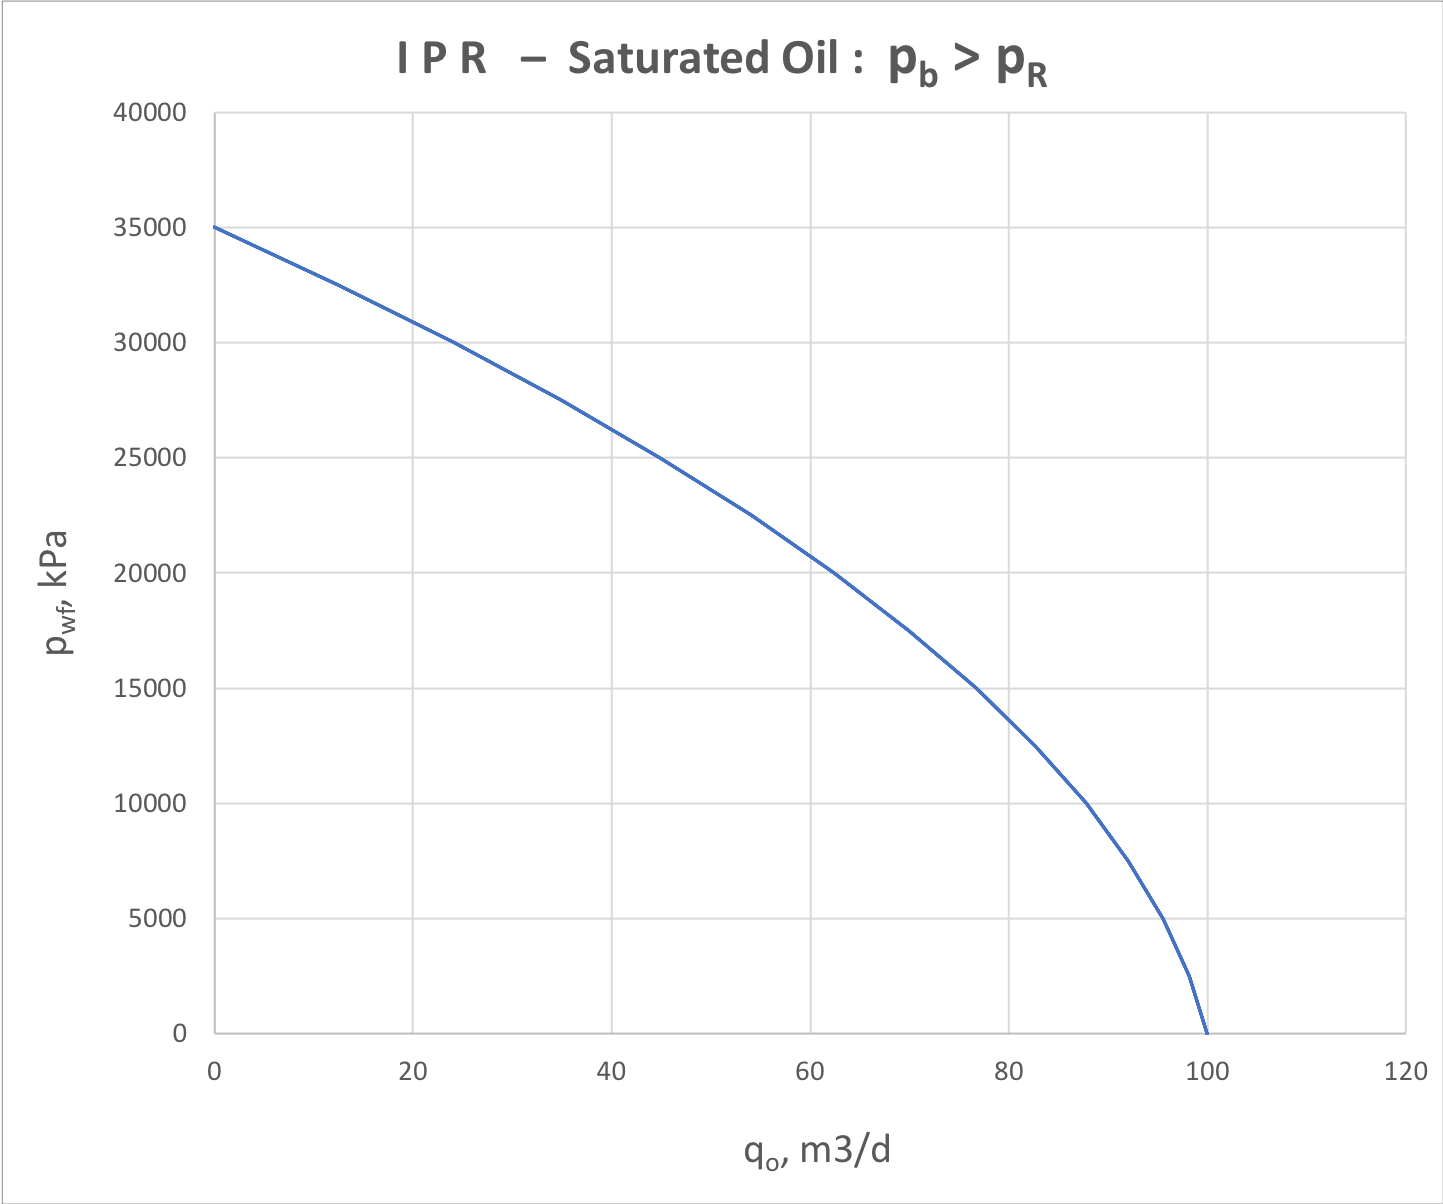
The analytical correlation for saturated oil reservoir flow is given by Vogel IPR @ model:
| (11) | \frac{q_O}{q_{O, \rm max}} = 1 - 0.2 \, \frac{p_{wf}}{p_r} - 0.8 \Bigg(\frac{p_{wf}}{p_r} \Bigg)^2 \quad , \quad p_b > p_r > p_{wf} |
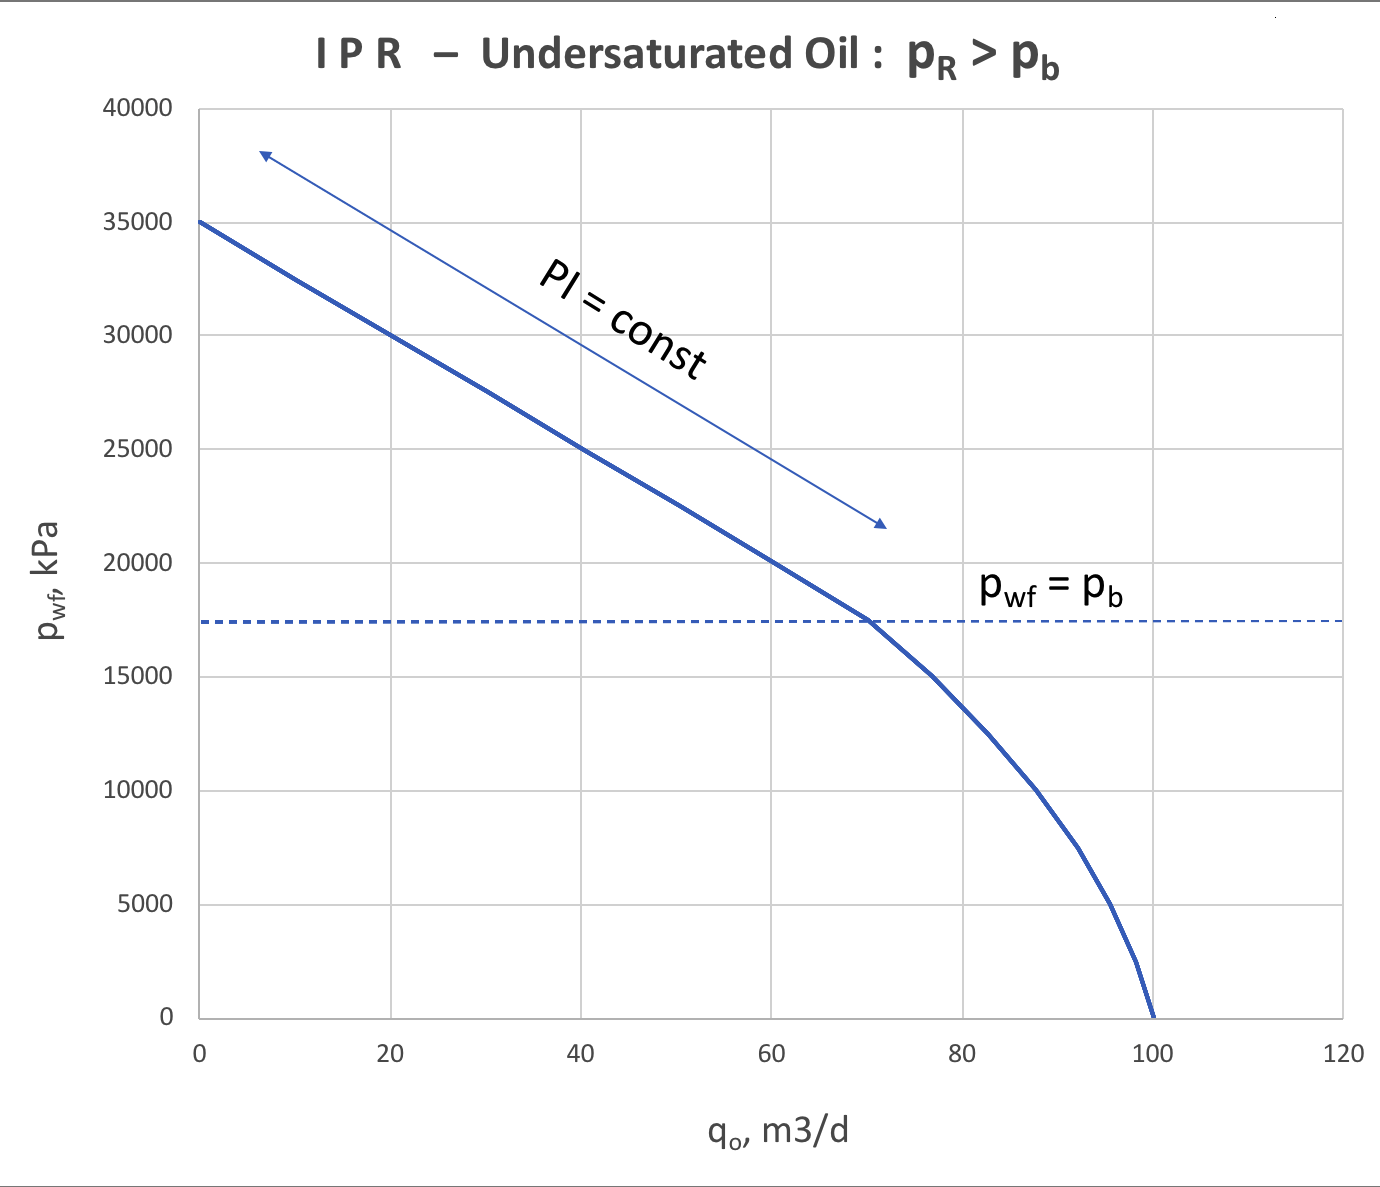
Undersaturated Oil IPR
For undersaturated oil reservoir p_r > p_b the behavior of IPR model will vary on whether the bottom-hole pressure is above or below bubble point.
When it is higher than bubble point p_{wf} > p_b then formation flow will be single-phase oil and production will follow the constant IPR.
When bottom-hole pressure goes below bubble point p_{wf} < p_b the near-reservoir zone free gas slippage also inflicts the downward trend at the right side of IPR plot (Fig. 5).
It can be interpreted as deterioration of near-reservoir zone permeability when the fluid velocity is high and approximated by rate-dependant skin-factor.
|
Fig. 5. IPR for 2-phase oil+gas production below and above bubble point |
The analytical correlation for undersaturated oil flow is given by modified Vogel model:
| (12) | \frac{q}{q_b} = \frac{p_r - p_{wf}}{p_r - p_b} \quad , \quad p_r > p_{wf} > p_b |
| (13) | q = (q_{max} - q_b ) \Bigg[ 1 - 0.2 \, \frac{p_{wf}}{p_b} - 0.8 \Bigg(\frac{p_{wf}}{p_b} \Bigg)^2 \Bigg] + q_b \quad , \quad p_r > p_b > p_{wf} |
with AOF q_{max} related to bubble point flowrate q_b via following correlation:
| (14) | q_{max} = q_b \, \Big[1 + \frac{1}{1.8} \frac{p_b}{(p_r - p_b)} \Big] |
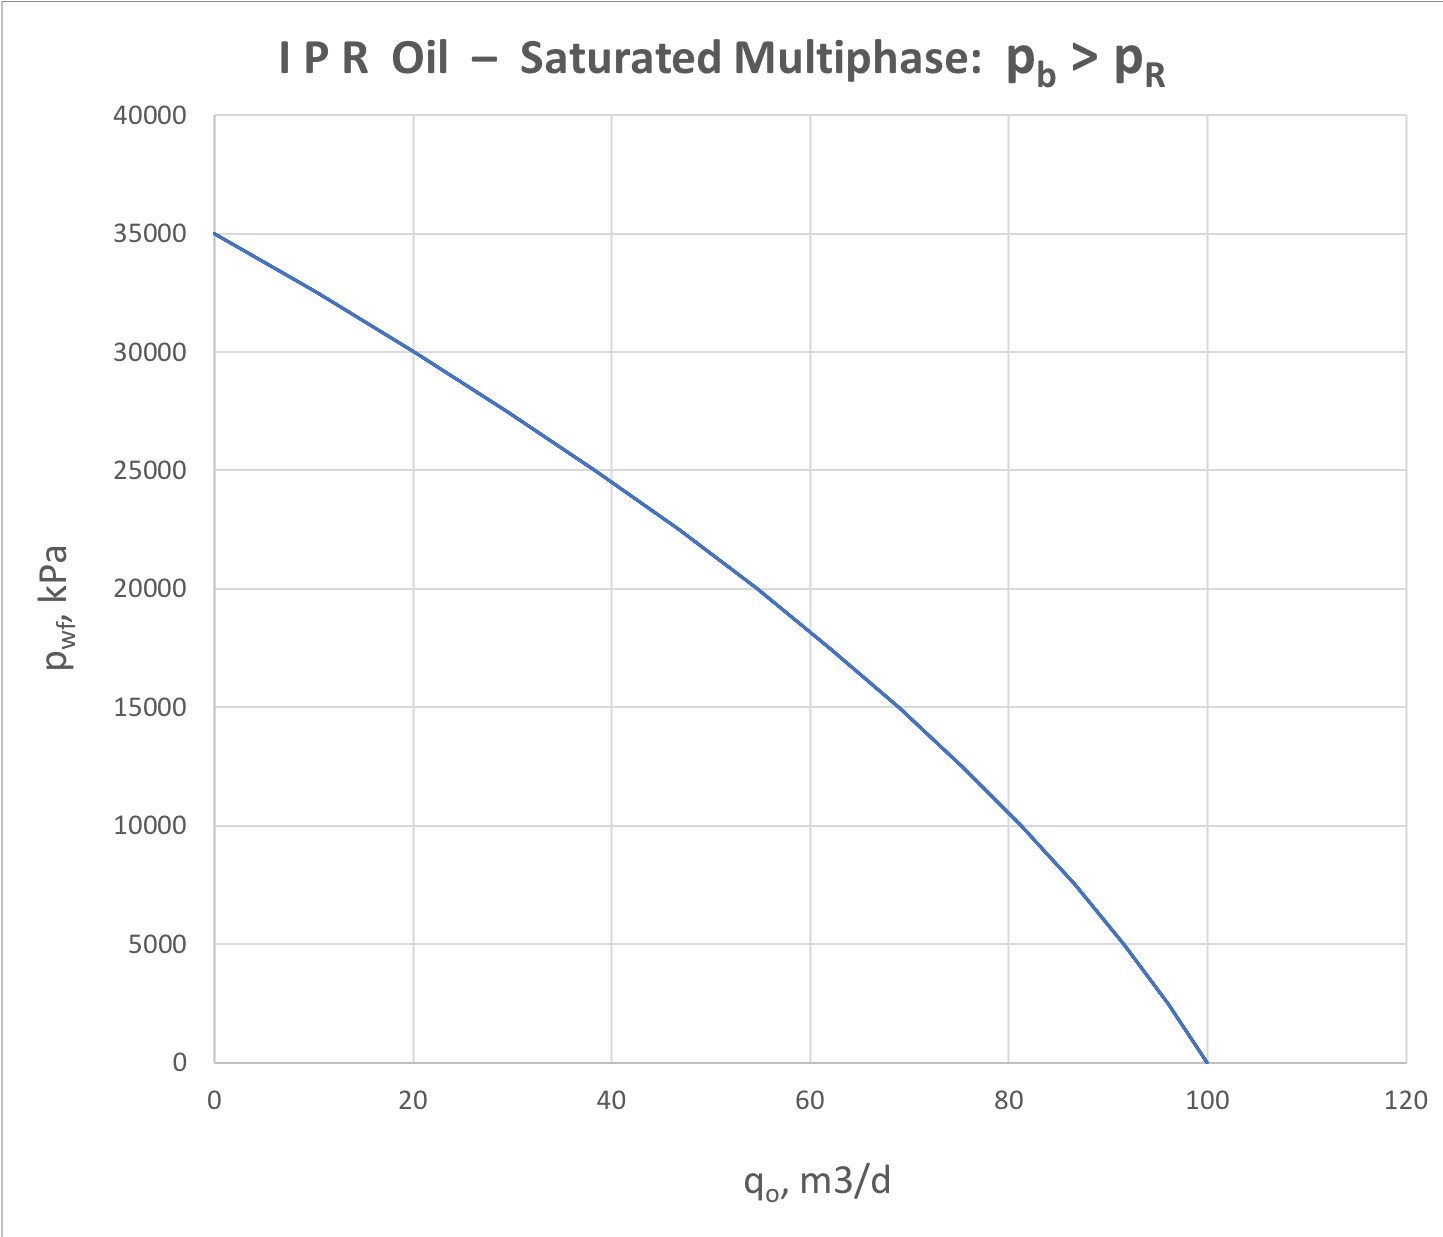
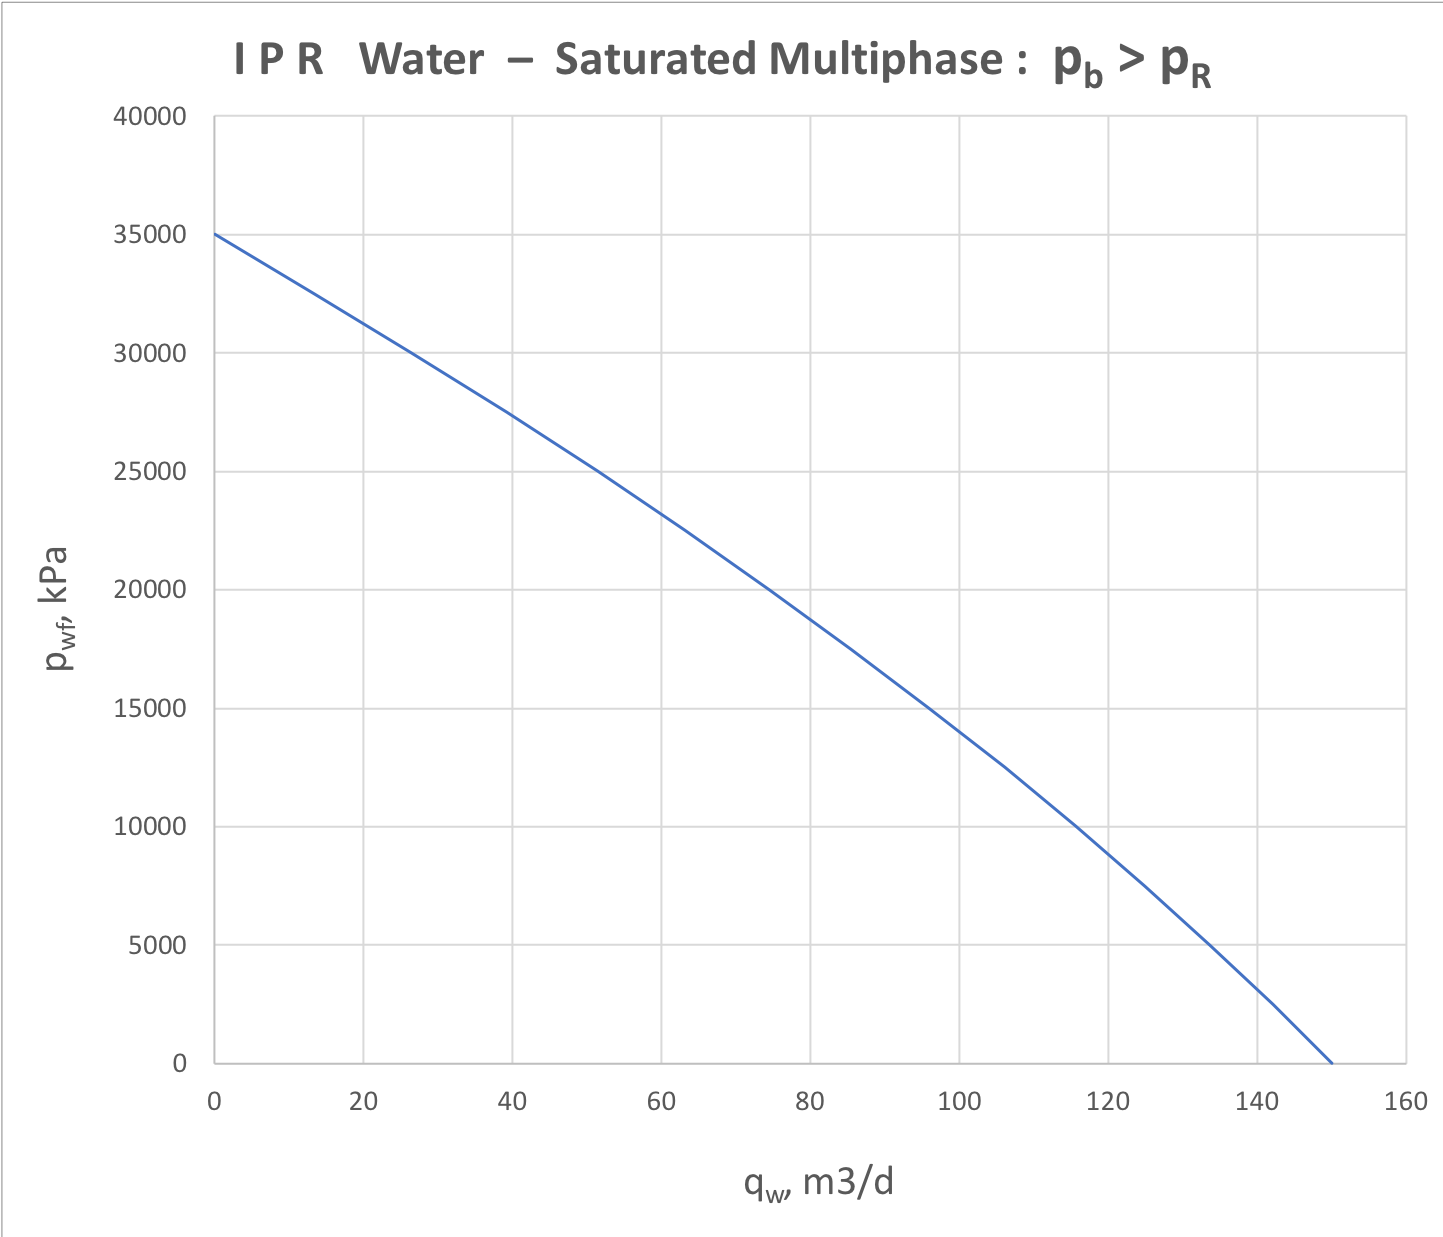
Saturated Multiphase IPR
For saturated 3-phase water-oil-gas reservoir the IPR analysis is represented by oil and water components separately (see Fig. 6.1 and Fig. 6.2).
|
|
Fig. 6.1. Oil IPR for saturated 3-phase (water + oil + gas) formation flow | Fig. 6.2. Water IPR for saturated 3-phase (water + oil + gas) formation flow |
The analytical correlation for saturated 3-phase oil flow is given by Wiggins model:
| (15) | \frac{q_o}{q_{o, \, max}} = 1 - 0.52 \, \frac{p_{wf}}{p_r} - 0.48 \Bigg(\frac{p_{wf}}{p_r} \Bigg)^2 |
| (16) | \frac{q_w}{q_{w, \, max}} = 1 - 0.72 \, \frac{p_{wf}}{p_r} - 0.28 \Bigg(\frac{p_{wf}}{p_r} \Bigg)^2 |
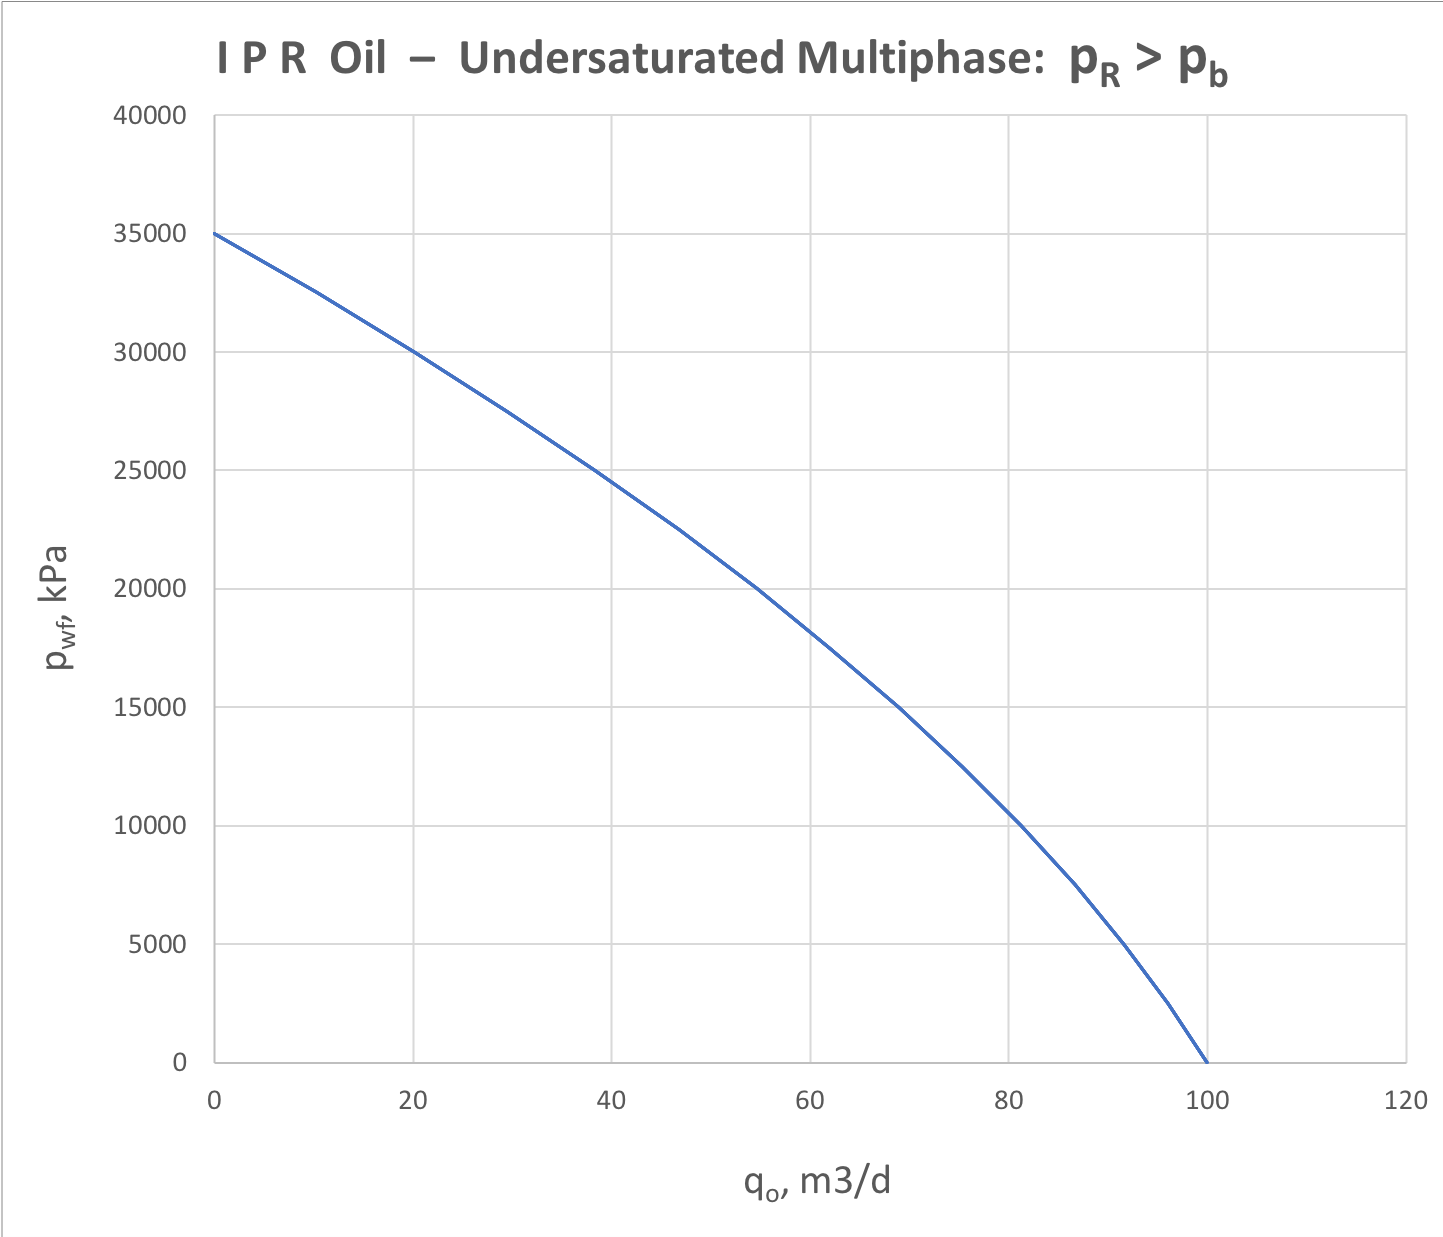
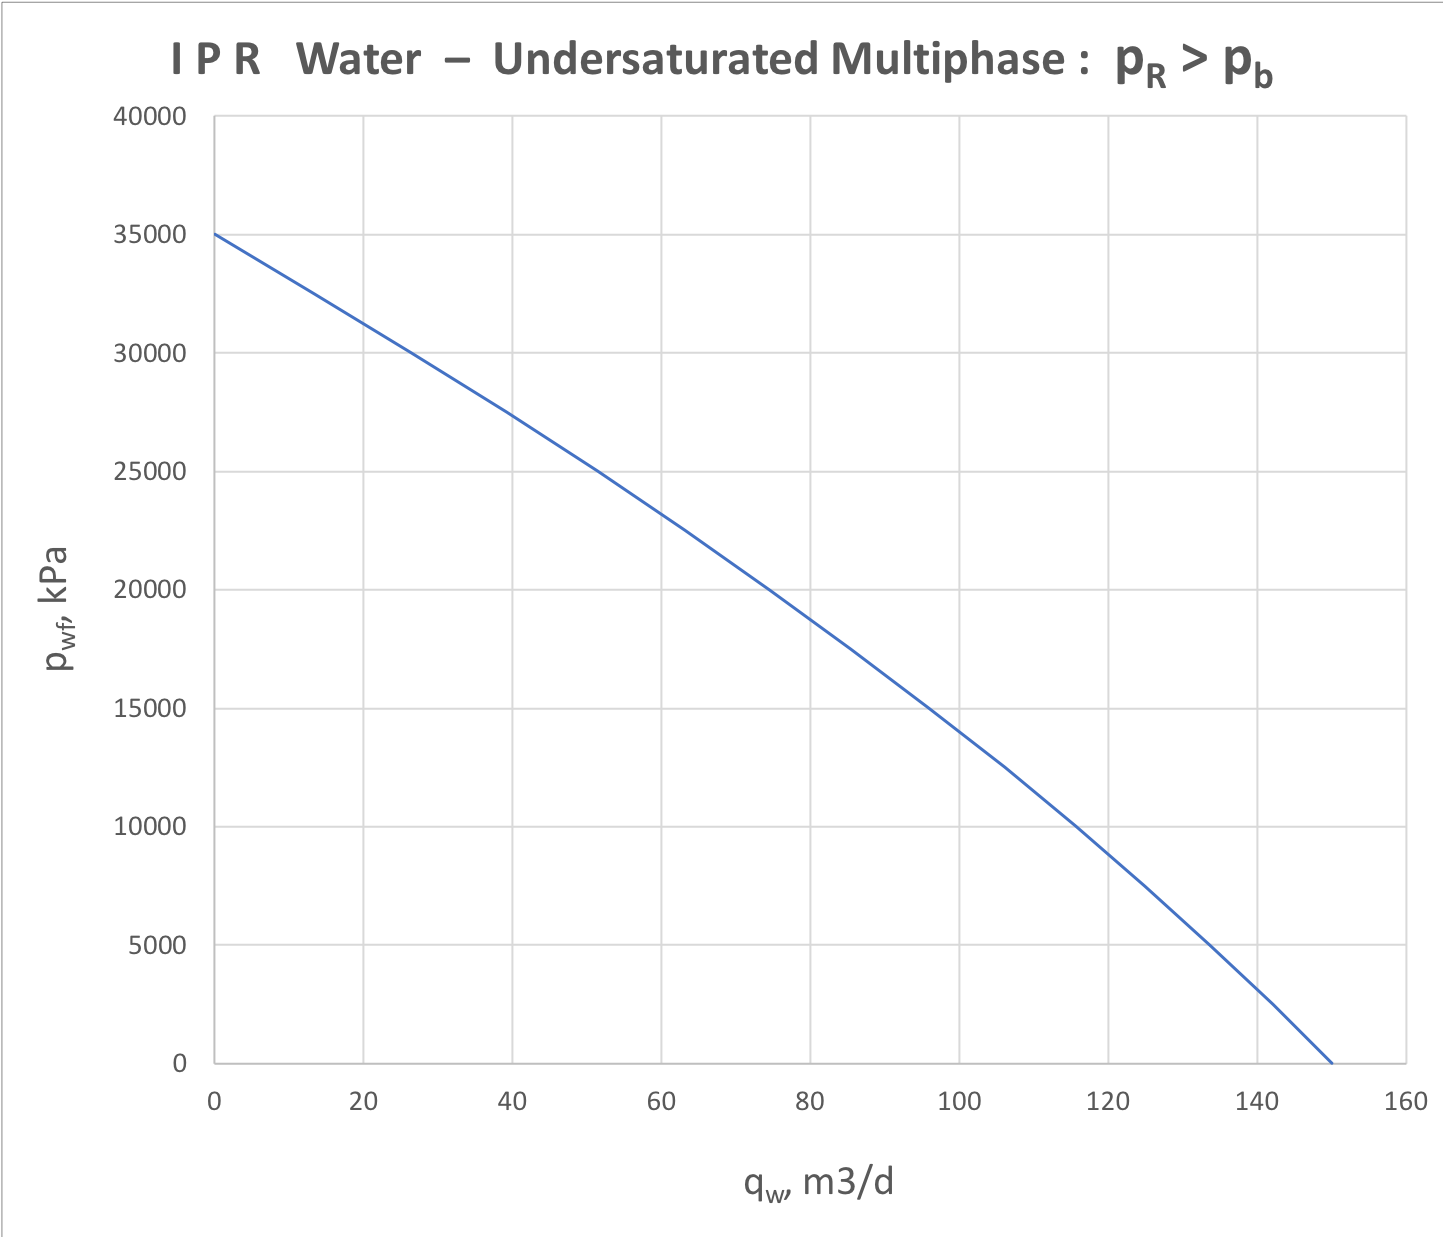
Undersaturated Multiphase IPR
For undersaturated 3-phase water-oil-gas reservoir the IPR analysis is represented by oil and water components separately (see Fig. 7.1 and Fig. 7.2).
|
|
Fig. 7.1. Oil IPR for udersaturated 3-phase (water + oil + gas) formation flow | Fig. 7.2. Water IPR for undersaturated 3-phase (water + oil + gas) formation flow |
See Also
Petroleum Industry / Upstream / Production / Subsurface Production / Subsurface E&P Disciplines / Field Study & Modelling / Production Analysis / Productivity Diagnostics
[ Production Technology / Well Flow Performance ]
[ Vogel IPR @model ] [ Richardson and Shaw IPR @ model ] [ Wiggins IPR @ model ][ LIT IPR @ model ][ PADE IPR @ model ]
[ Dual-layer IPR][ Multi-layer IPR ] [ Dual-layer IPR with dynamic fracture ]
Reference
Gilbert, W.E.: "Flowing and Gas-Lift Well Performance," Drill. and Prod. Prac., API (1954) 126.